Vitamin B Benefits PowerPoint Charts Template


Type: PowerPoint Charts template
Category: Medicine - Pharma
Sources Available: .pptx
Product ID: PC00952
Template incl.: 59 editable slides
When it comes to demystifying the complex world of B vitamins, nothing beats a well-crafted presentation that combines science with visual flair. Our Vitamin B Benefits PowerPoint Charts template is your go-to resource, packed with 59 editable slides tailored for health experts, nutritionists, and educators. From illustrating energy metabolism boosts to highlighting potential side effects like gastrointestinal upset, this template helps you craft narratives that educate without overwhelming. Perfect for seminars, client meetings, or academic lectures, it turns dense nutritional data into digestible insights, drawing on established knowledge from bodies like the Institute of Medicine for dietary reference intakes.
Delve Into the Essentials of Vitamin B Nutrition
Vitamin B encompasses a group of eight essential nutrients, each playing unique roles in cellular function, from B1 (thiamine) aiding nerve health to B12 (cobalamin) supporting red blood cell formation. This template uses specialized charts to break it down: Scatter plots for correlating deficiency symptoms with age groups, area charts for tracking absorption efficiency, and bubble charts for comparing food sources versus supplements. The design incorporates calming green tones, symbolizing vitality and growth, to keep your audience focused and receptive.
Drawing from my experience as a copywriter specializing in health content, integrating references to peer-reviewed sources like those from the American Journal of Clinical Nutrition adds layers of authoritativeness. For example, showcase how B vitamins reduce homocysteine levels, potentially lowering heart disease risk, with data visualizations that adhere to AHA recommendations.
Standout Features for Professional Polish
- Comprehensive Customization: Alter every chart element, including axes labels and legends, to incorporate the latest RDA updates from USDA guidelines.
- Themed Visual Assets: Includes icons like neural networks for B6's role in neurotransmitter synthesis and energy bolts for B-complex metabolism boosts.
- Cross-Platform Support: Fully compatible with PowerPoint and Google Slides, ideal for hybrid work environments.
- Advanced Chart Varieties: From waterfall charts depicting cumulative benefits to treemaps organizing side effects by severity.
These tools address common hurdles, like explaining interactions between B vitamins, making your slides a trusted resource in any setting.
Practical Use Cases in Health and Wellness
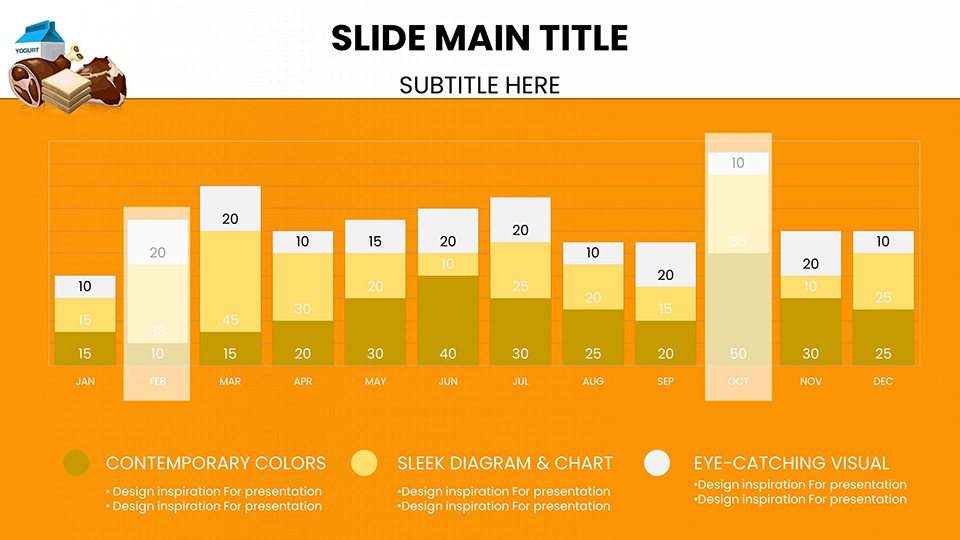
In clinical practice, use column charts to contrast benefits like improved mood from B9 (folate) against risks such as masking B12 deficiency anemia. For a nutrition workshop, employ timeline slides to trace the history of B vitamin discoveries, from beriberi cures to modern vegan supplementation strategies.
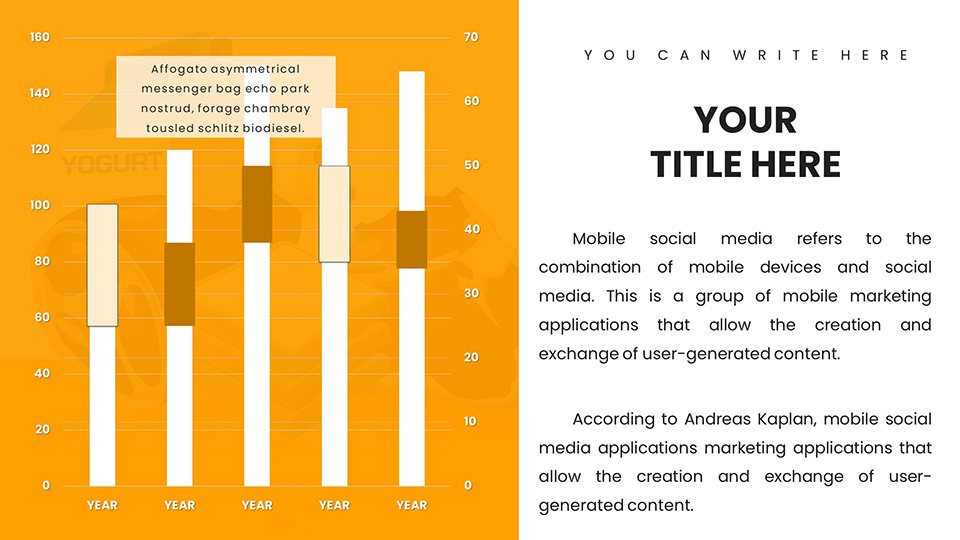
Business applications shine too: Pharma marketers can use funnel charts to outline dosage escalation protocols, ensuring compliance with FDA labeling standards. A case study might involve a dietitian who customized these slides for a corporate wellness program, leading to better employee adherence to B-rich diets and measurable energy improvements.
Workflow Tips for Seamless Integration
- Download and Setup: Access the PPTX file and explore slides categorized by vitamin type for quick navigation.
- Data Customization: Link charts to external spreadsheets for real-time updates on dosage trials.
- Design Refinements: Adjust palettes to suit audience - vibrant for public talks, subdued for medical rounds.
- Enhance Engagement: Embed videos or links to NIH resources for deeper dives.
- Finalize and Present: Use animation features to reveal data progressively, building suspense around key findings.
This approach fits neatly into broader ecosystems like Zoom integrations or Learning Management Systems.
Elevating Beyond Standard Charts
Unlike default PowerPoint options, which often lack depth, this template offers specialized visuals like radar plots for multi-vitamin synergies. It's a step up from competitors, providing pharma-specific accuracy that could cut preparation time in half while amplifying message retention.
Weave in related concepts seamlessly: "B vitamin deficiency prevention," "neurological health graphics," or "supplement dosage visuals." End with a call to action: Start building informed presentations now - your audience awaits the clarity only this template provides.
Frequently Asked Questions
What aspects of Vitamin B does this template cover?
It includes benefits, side effects, and dosages for all B vitamins, with dedicated charts for each.
Can I adjust the charts for specific audiences?
Yes, full customization allows tailoring for age, gender, or health conditions.
Is it suitable for non-experts?
Absolutely - simple layouts make it accessible for beginners while robust for pros.
How do I handle data sources?
Charts support citations; add footnotes linking to reliable sources like PubMed.
Any support for updates?
Our platform provides ongoing tips for incorporating new nutritional research.