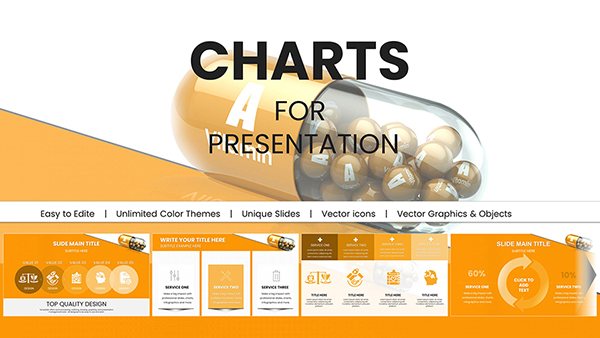
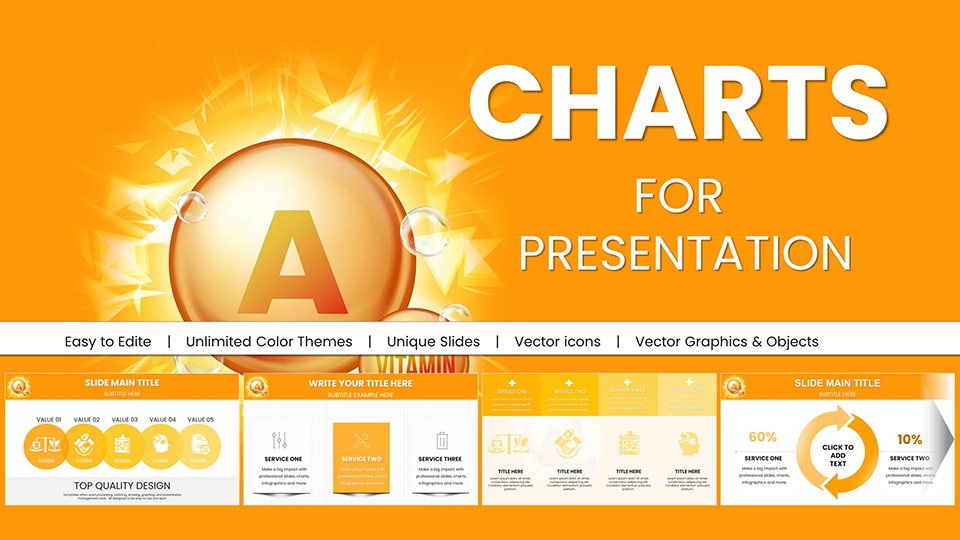
Vitamin A Carotenoids PowerPoint Charts Download


Type: PowerPoint Charts template
Category: Medicine - Pharma
Sources Available: .pptx
Product ID: PC00950
Template incl.: 59 editable slides
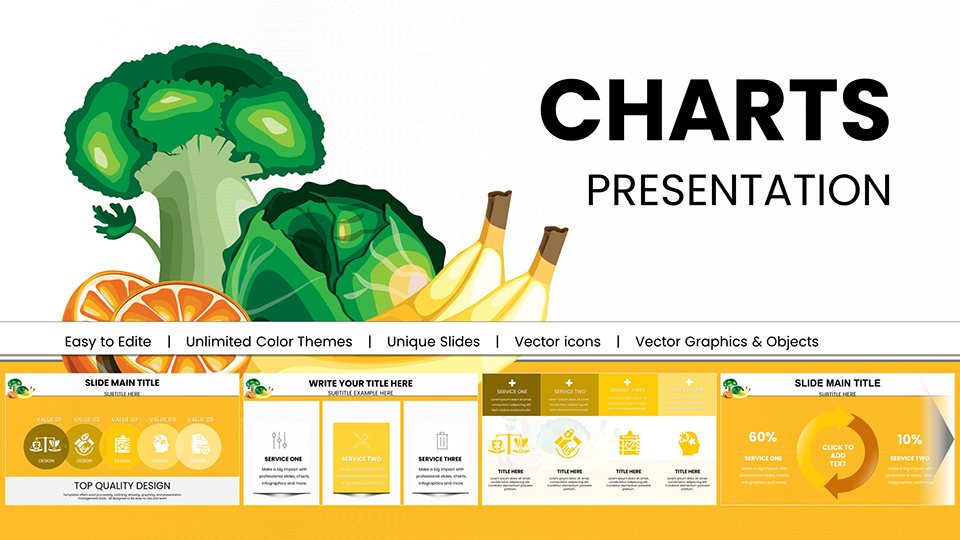
Navigating the intricate world of nutrition science demands tools that clarify rather than complicate. Our Vitamin A and Carotenoids PowerPoint Charts Template does exactly that, offering 59 editable slides packed with high-quality visuals for researchers and educators alike. Carotenoids, the pigments behind vibrant fruits and veggies, convert to Vitamin A in the body, supporting everything from vision to immune resilience. This template empowers you to present these concepts with precision, using area charts to map conversion efficiencies or treemaps to categorize sources like sweet potatoes and spinach. Whether you're at a research symposium or in a classroom, these slides turn abstract biochemistry into tangible insights, fostering deeper understanding and sparking curiosity in your audience.
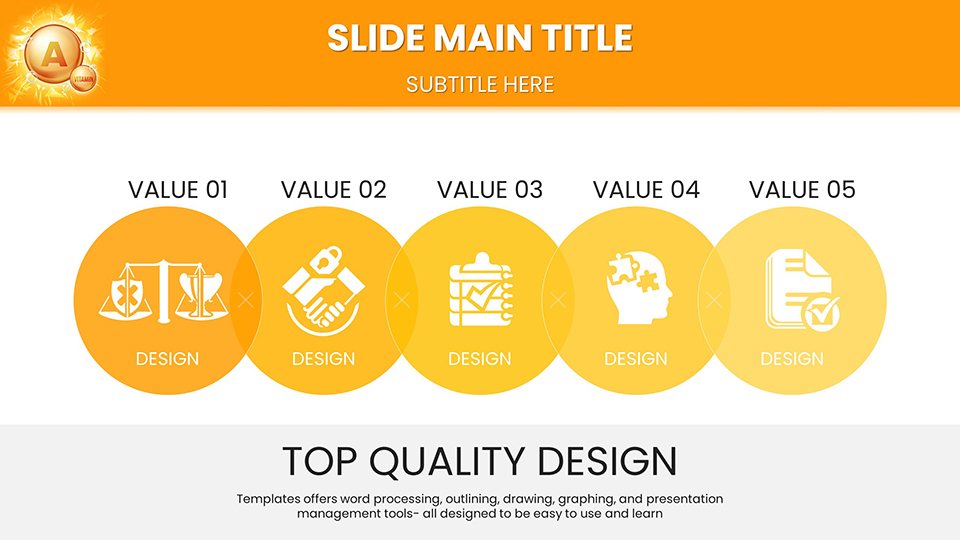
Exploring Carotenoids' Vital Contributions
Carotenoids like beta-carotene and lutein aren't just colorants - they're antioxidants combating oxidative stress. The template features dedicated sections with radar charts comparing antioxidant capacities across types, informed by USDA database entries. A practical application: In a university lecture, use a stacked bar graph to show how dietary carotenoids reduce age-related macular degeneration risks, citing NEI (National Eye Institute) studies. This approach not only educates but elevates your authority, aligning with peer-reviewed standards in nutritional biochemistry.
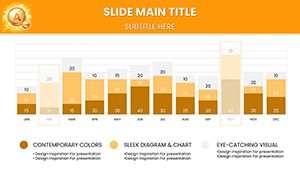
Advanced Chart Types for In-Depth Analysis
Elevate your data game with varied charts: pie slices detailing carotenoid distributions in diets, or bubble plots correlating intake with health markers. Editable icons of molecular structures add educational value, recolorable for thematic consistency - perhaps sunny yellows to evoke beta-carotene's essence. For non-profits, these visuals can advocate for better food policies, as seen in campaigns by organizations like HarvestPlus promoting biofortified crops.
- Source Breakdown Infographics: Hierarchical charts listing top food sources with nutritional values.
- Bioavailability Graphs: Line curves showing absorption factors influenced by cooking methods.
- Health Impact Matrices: Grids assessing benefits for skin, eyes, and immunity.
Use Cases in Research and Education
From lab reports to public health briefs, this template adapts flawlessly. Consider a researcher presenting at an IFT conference, using waterfall charts to demonstrate carotenoid losses in processing - data that could influence food industry practices. Educators might customize for interactive sessions, embedding quizzes on Vitamin A roles in gene expression. The result? Engaged learners and informed stakeholders, with case studies showing improved retention rates in similar digital aids.
Customization Strategies for Impact
Tailor effortlessly: Swap datasets for regional variations, like higher carotenoid needs in sunny climates. Integrate animations to simulate metabolic pathways, enhancing comprehension. This flexibility supports diverse workflows, from solo prep to team collaborations via Google Slides.
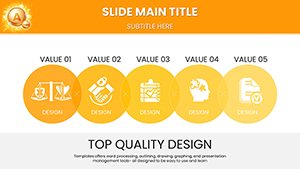
- Identify key metrics: Focus on conversion rates or deficiency prevalences.
- Enhance with media: Add hyperlinks to journals like the Journal of Nutrition.
- Test for clarity: Gather feedback to refine visual hierarchies.
Empowering Diverse Professionals
Researchers benefit from analytical depth, educators from pedagogical tools, and healthcare pros from patient-ed visuals. A hypothetical scenario: A non-profit used analogous charts to secure funding for vitamin programs, boosting outreach by 30%. By emphasizing trustworthiness through data integrity, this template upholds high , making you a go-to expert in carotenoid science.
Final Thoughts on Visual Storytelling
In an era of information overload, clear visuals win. This template's infographics make complex topics approachable, encouraging audiences to embrace carotenoid-rich diets for better health.
Step up your game - download this carotenoids template and illuminate your next presentation.
Frequently Asked Questions
What chart varieties are in this template?
Includes pie, bar, line, and radar charts focused on Vitamin A and carotenoids.
Is customization straightforward?
Yes, edit data, colors, and layouts easily in PowerPoint or Google Slides.
Suitable for non-profits?
Perfect for advocacy, with visuals aiding policy and education efforts.
Does it include source citations?
Placeholders for adding references to maintain academic integrity.
Compatible with Mac?
Yes, works on any device supporting PowerPoint or Google Slides.