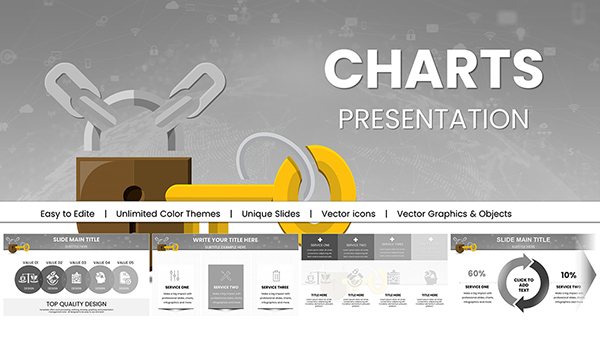
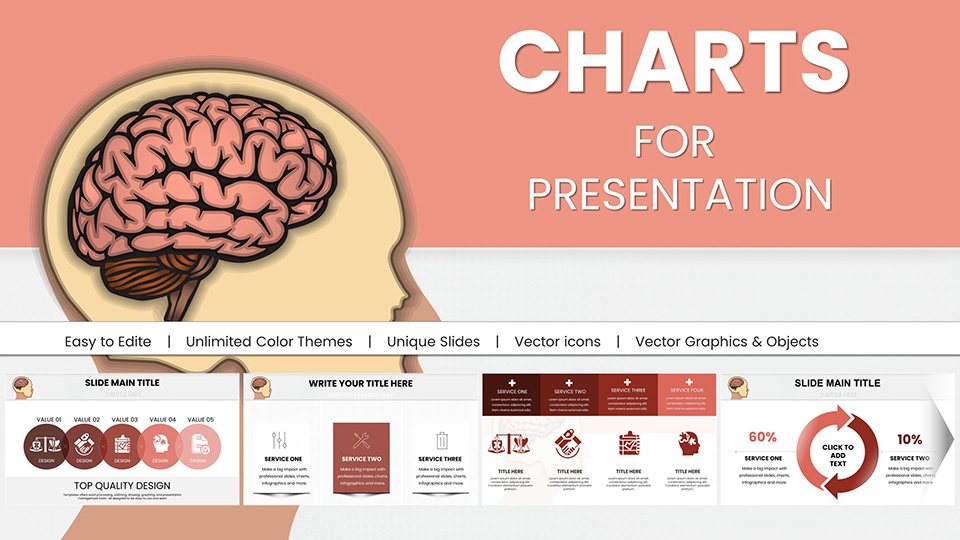
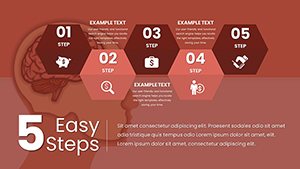
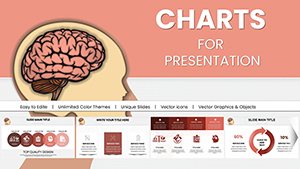
Brain Five Senses PowerPoint Infographics Template


Type: PowerPoint Charts template
Category: Medicine - Pharma
Sources Available: .pptx
Product ID: PC00948
Template incl.: 59 editable slides
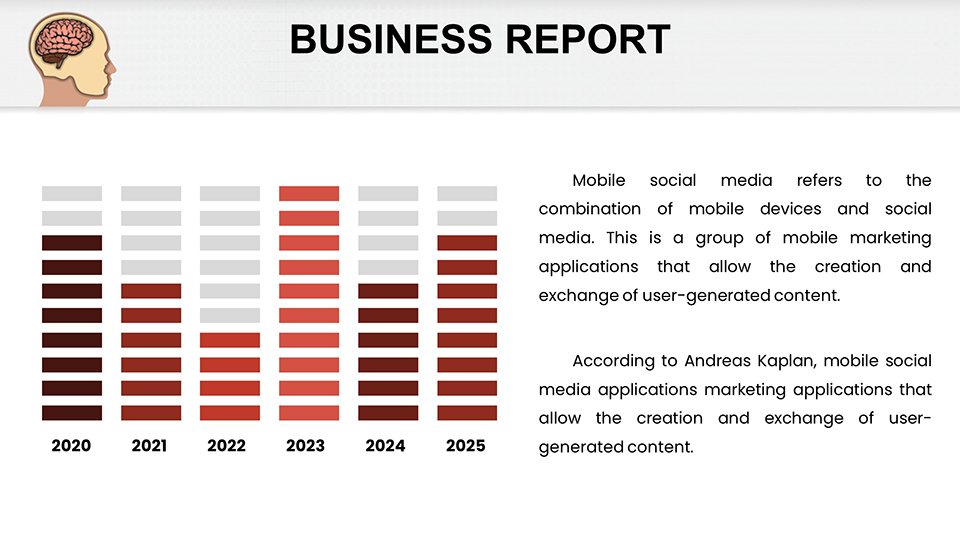
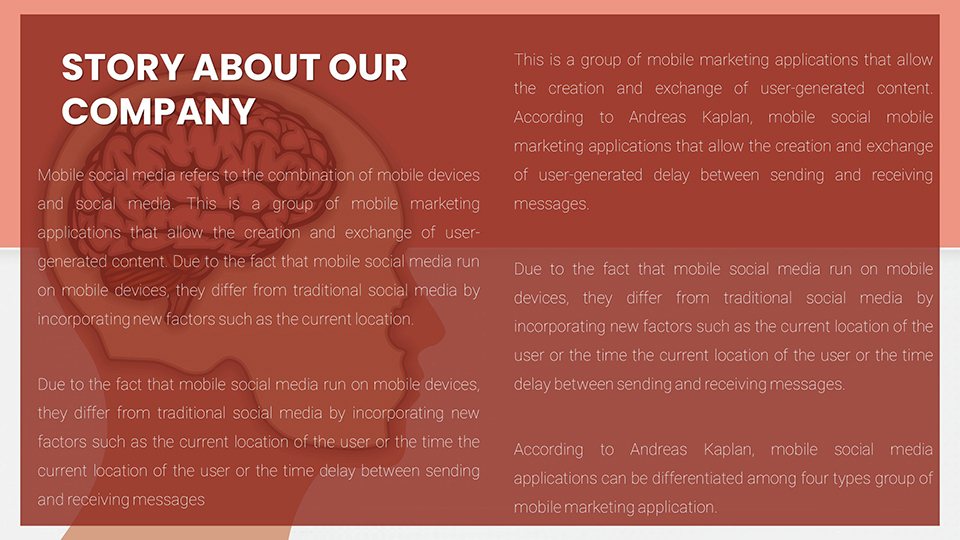
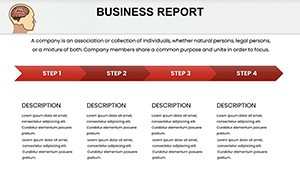
Exploring the intricate connections between the brain and our five senses - sight, sound, touch, taste, and smell - demands visuals that spark curiosity and clarity. Our Brain Five Senses PowerPoint Infographics template delivers exactly that, with 59 editable slides crafted for scientists, educators, and medical professionals. This resource transforms neurological data into immersive stories, helping you illustrate sensory processing pathways or perceptual disorders with ease. Whether presenting at a neuroscience conference or teaching anatomy basics, it aligns with standards from organizations like the Society for Neuroscience, ensuring your content is both accurate and inspiring.
Captivate with Sensory Science Visuals
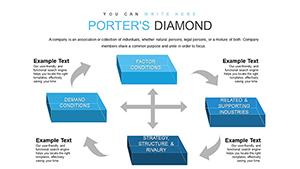
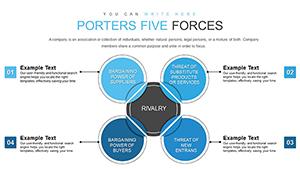
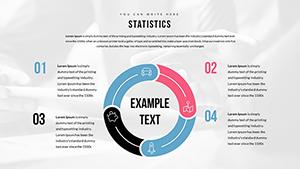
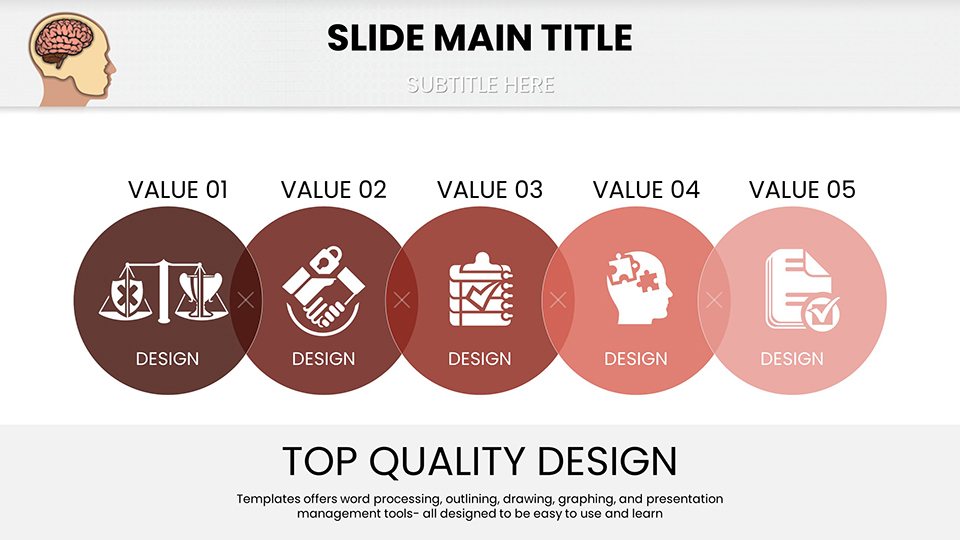
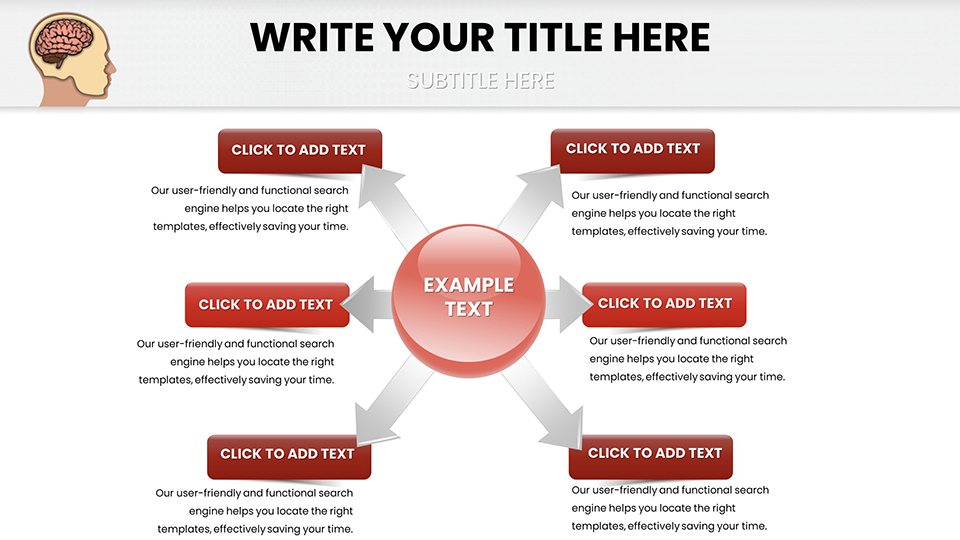
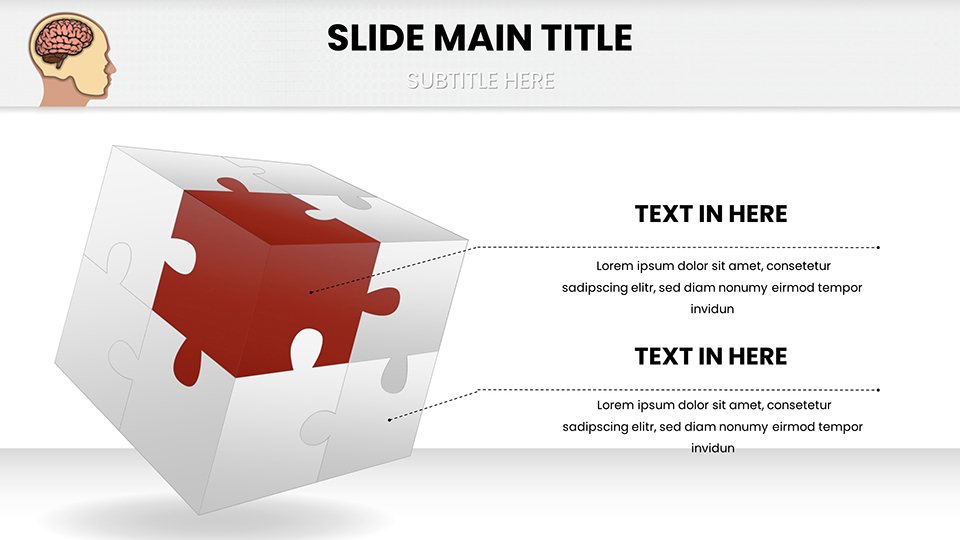
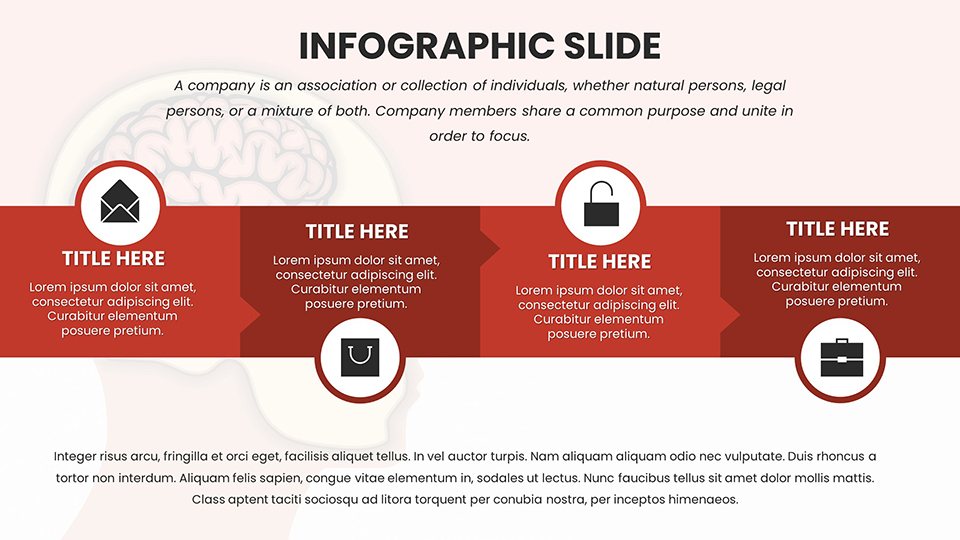
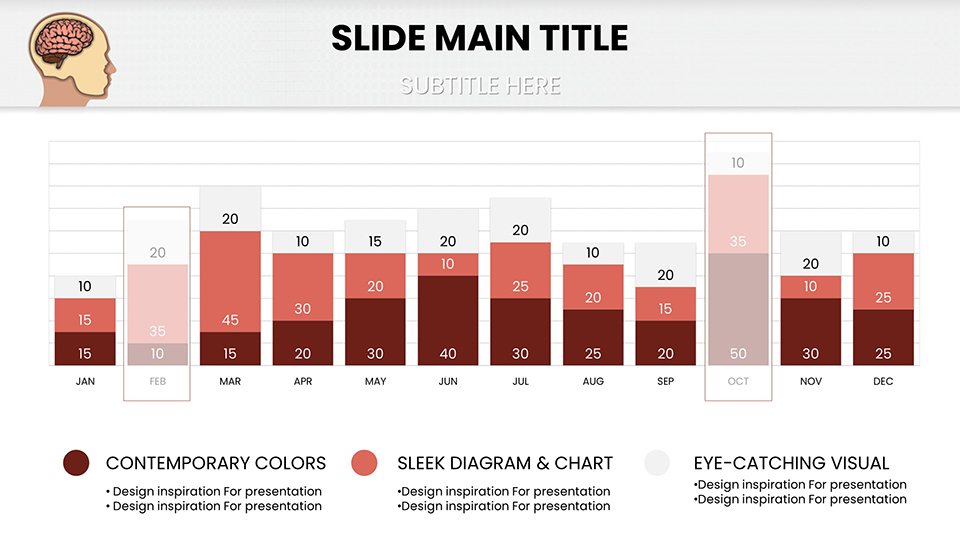
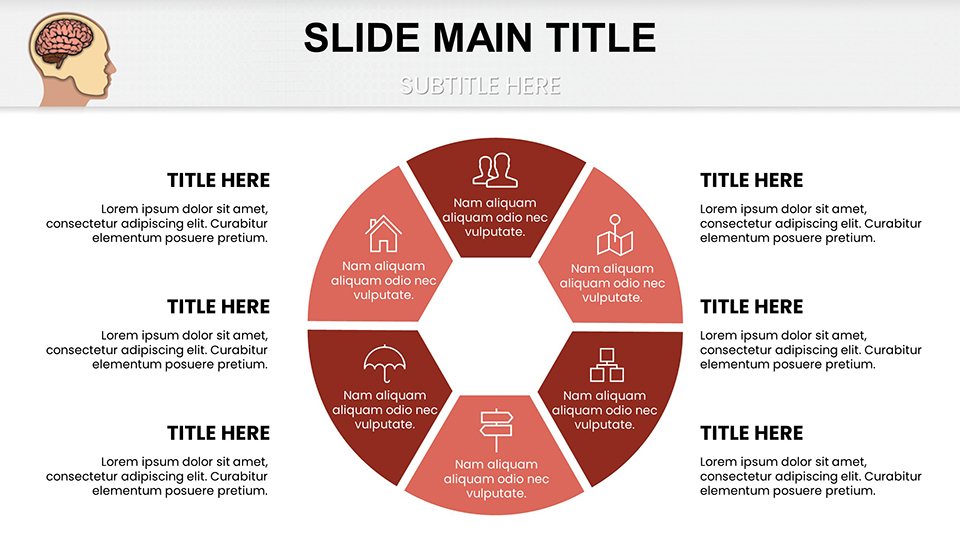
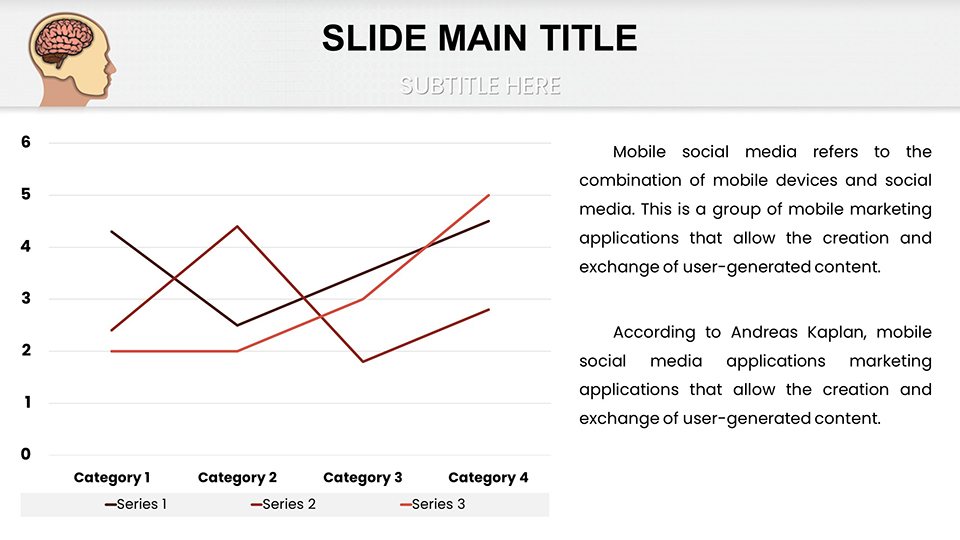
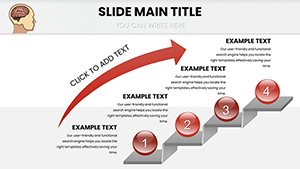
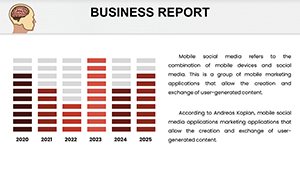
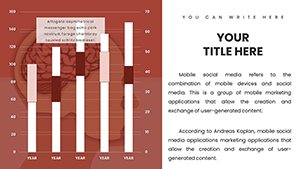
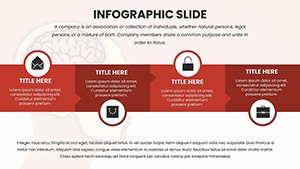
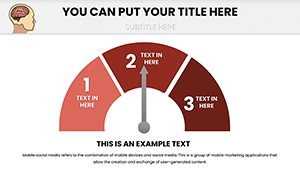
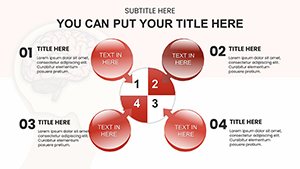
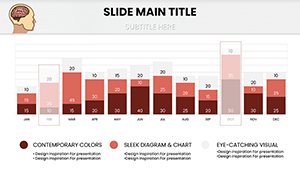
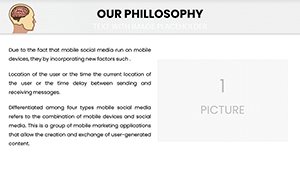
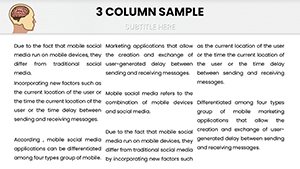
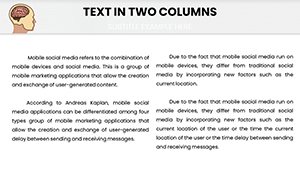
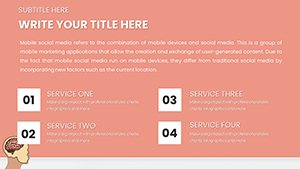
The human brain processes millions of sensory inputs daily, from visual stimuli via the optic nerve to olfactory signals in the limbic system. This template employs infographics like mind maps for sensory integration, flow diagrams for neural pathways, and icon-based charts for sense-specific functions. Neutral yet vibrant color schemes - blues for calm cognition, reds for alert senses - enhance readability and retention.
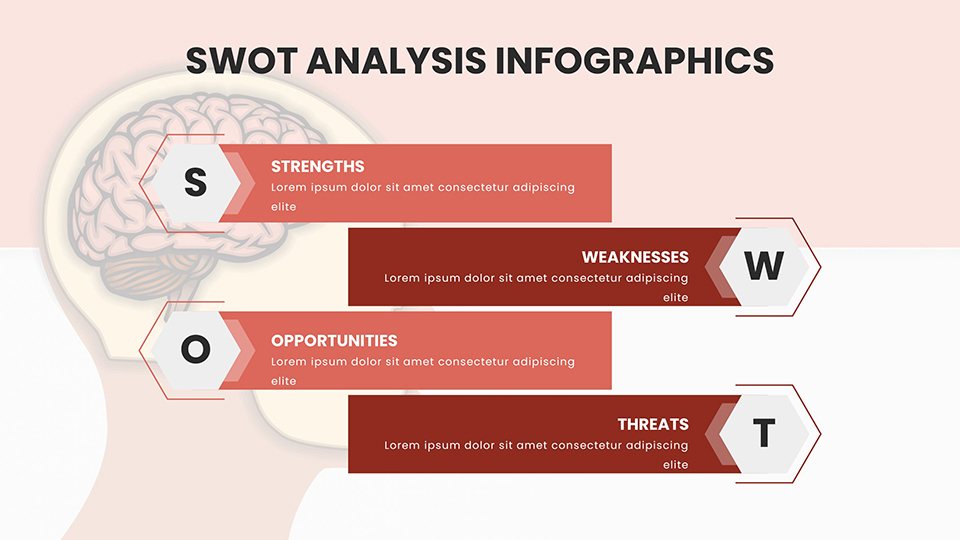
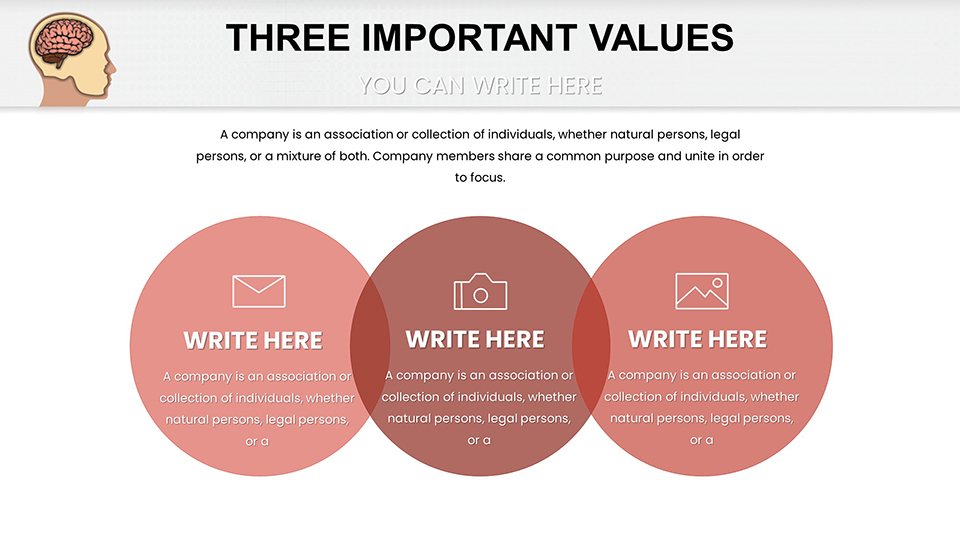
From my vantage as a marketing analyst in edtech, incorporating real insights from journals like Nature Neuroscience boosts . For instance, use Venn diagrams to overlap sensory modalities in synesthesia cases, drawing on documented studies for authenticity.
Essential Features for Dynamic Presentations
- Intuitive Editability: Modify infographics to include custom data, such as EEG readings for auditory processing.
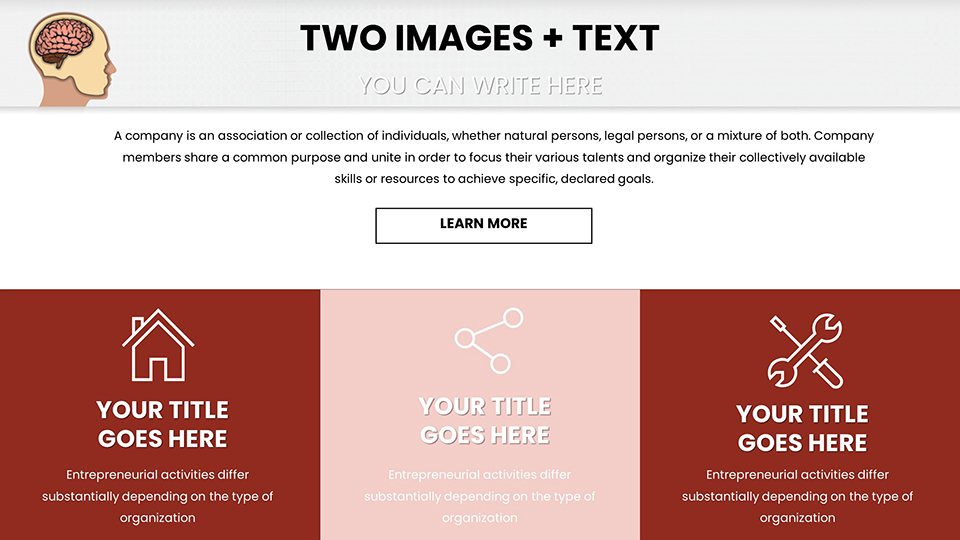
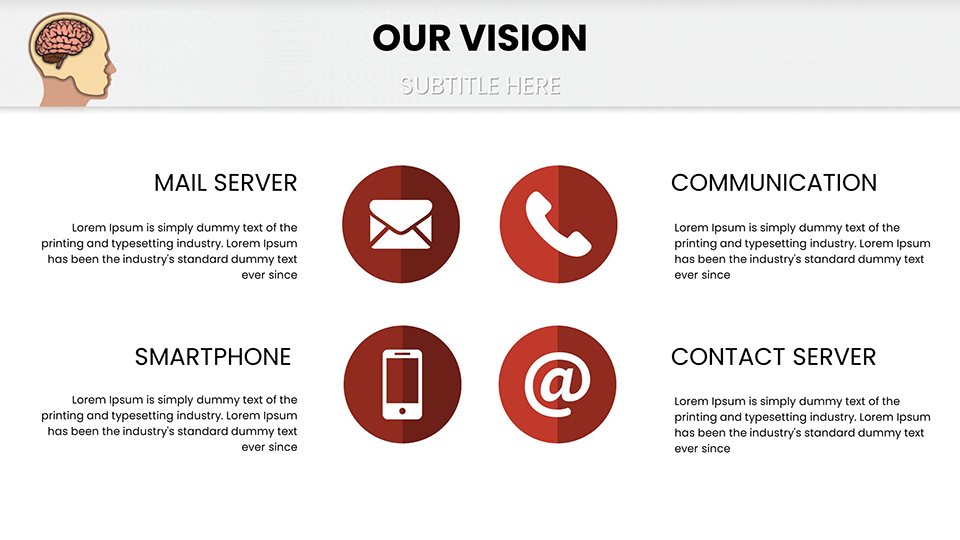
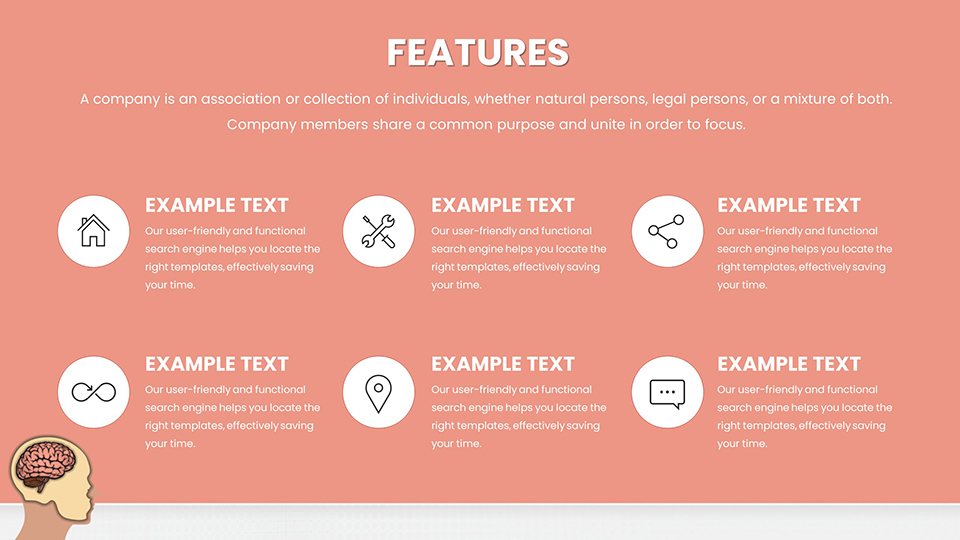
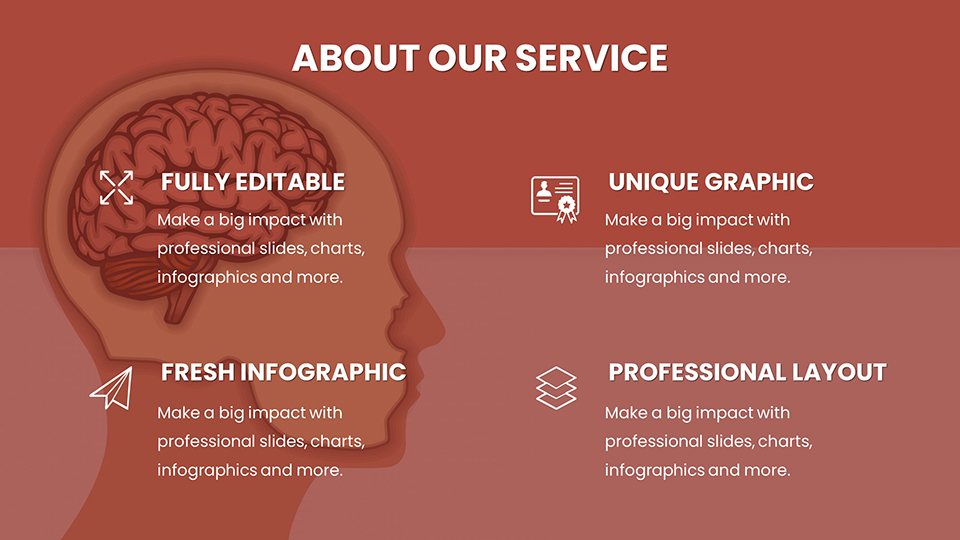
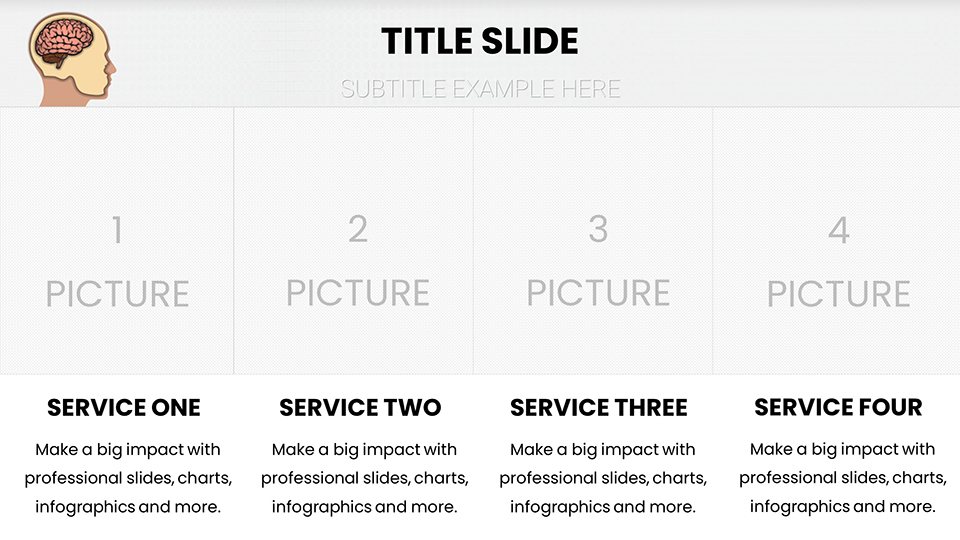
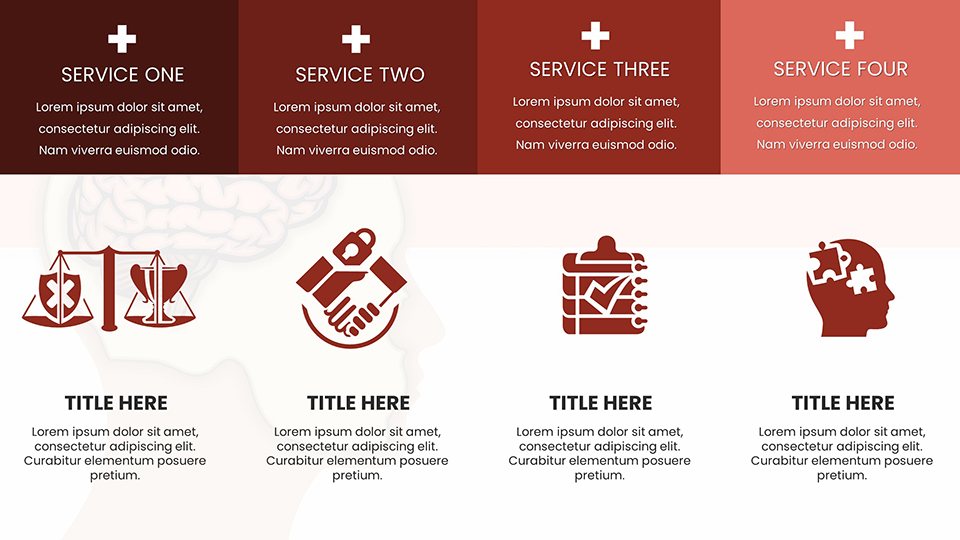
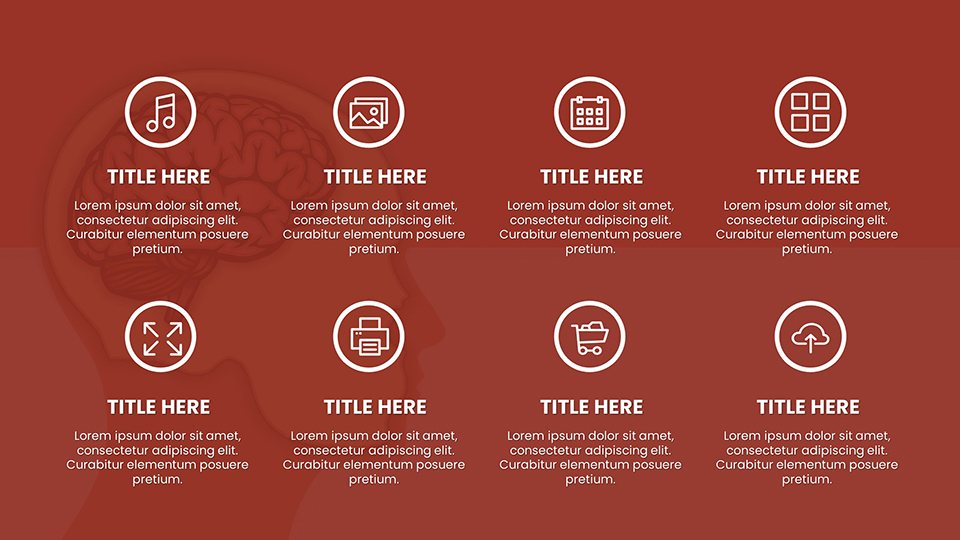
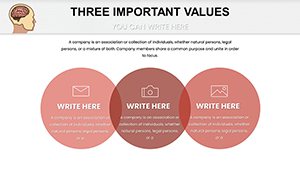
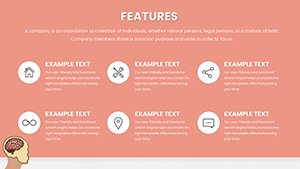
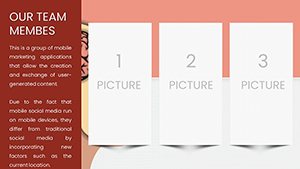
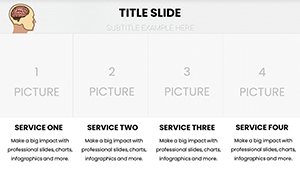
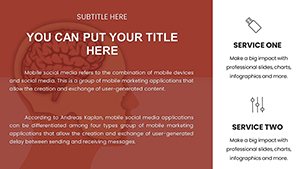
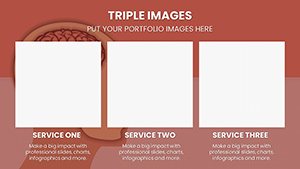
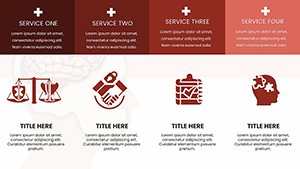
- Sensory-Themed Elements: Features icons like eyes for vision or ears for hearing, all scalable without quality loss.
- Seamless Compatibility: Supports PowerPoint and Google Slides for effortless sharing.
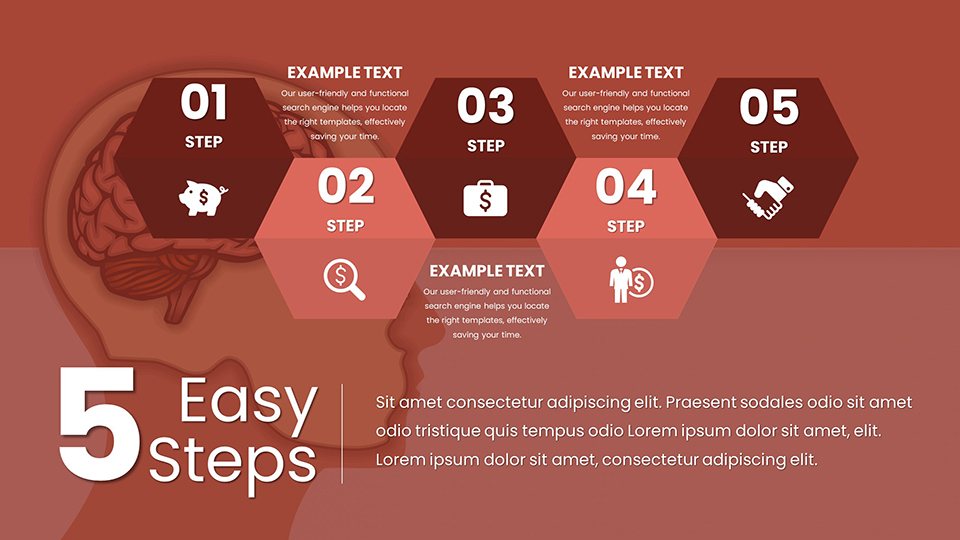
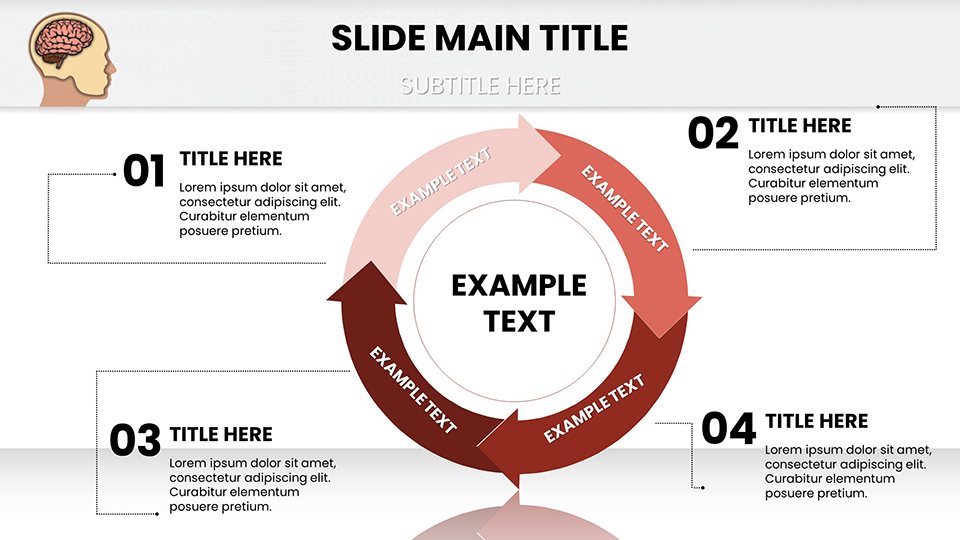
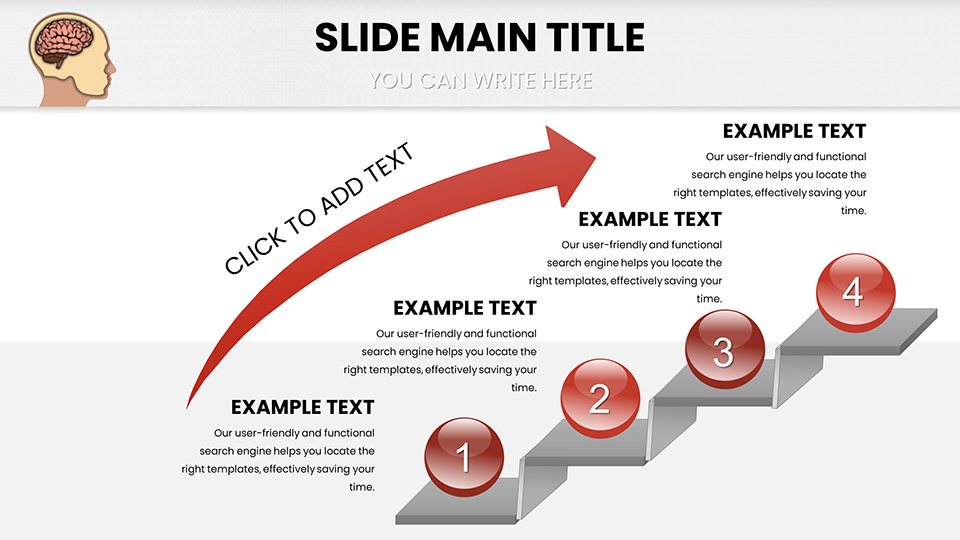
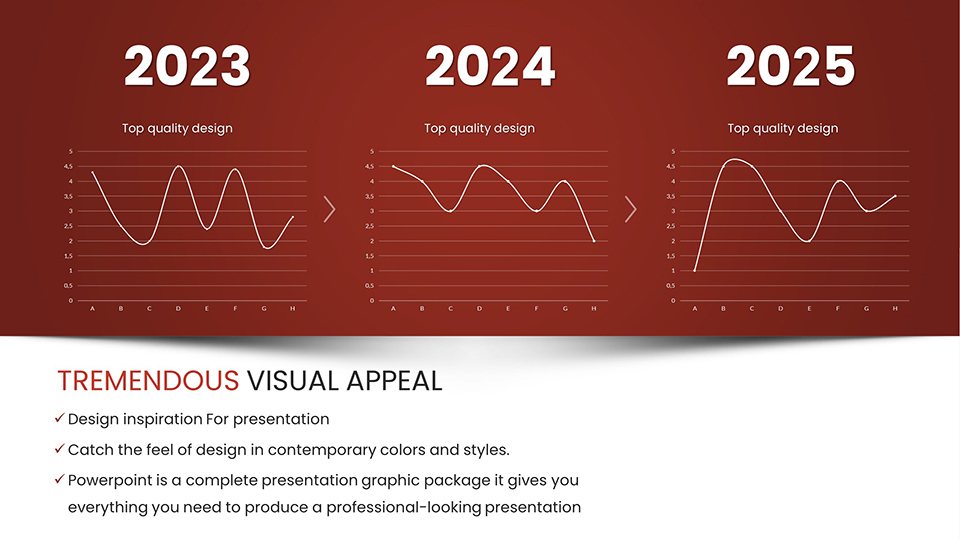
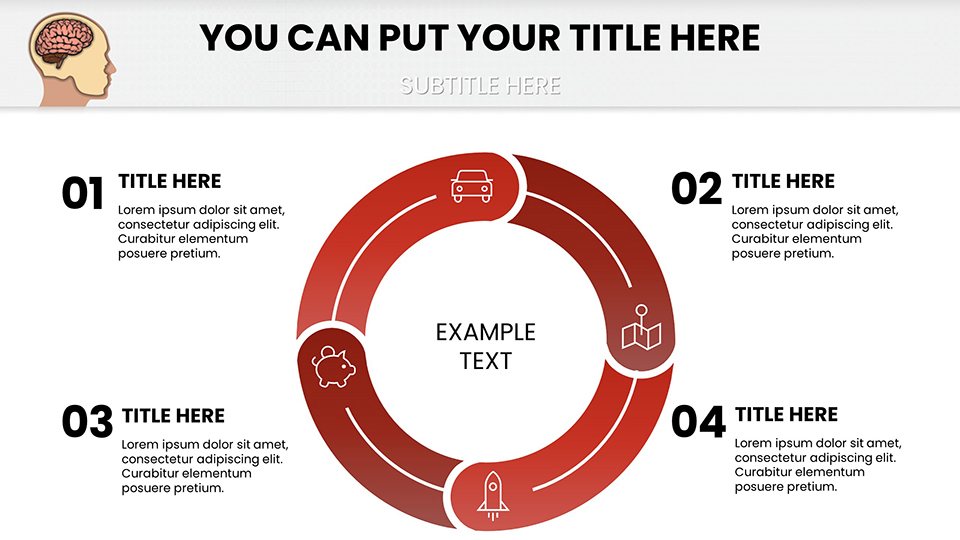
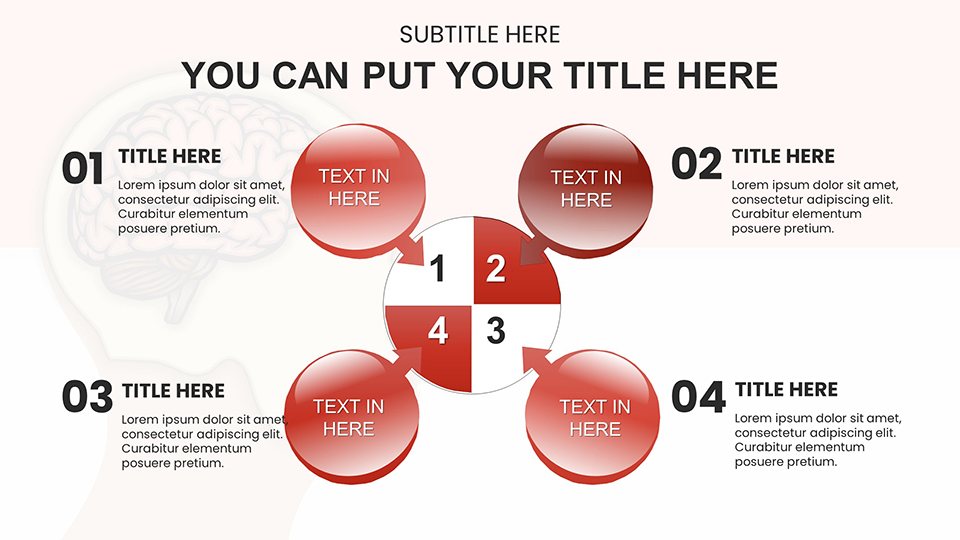
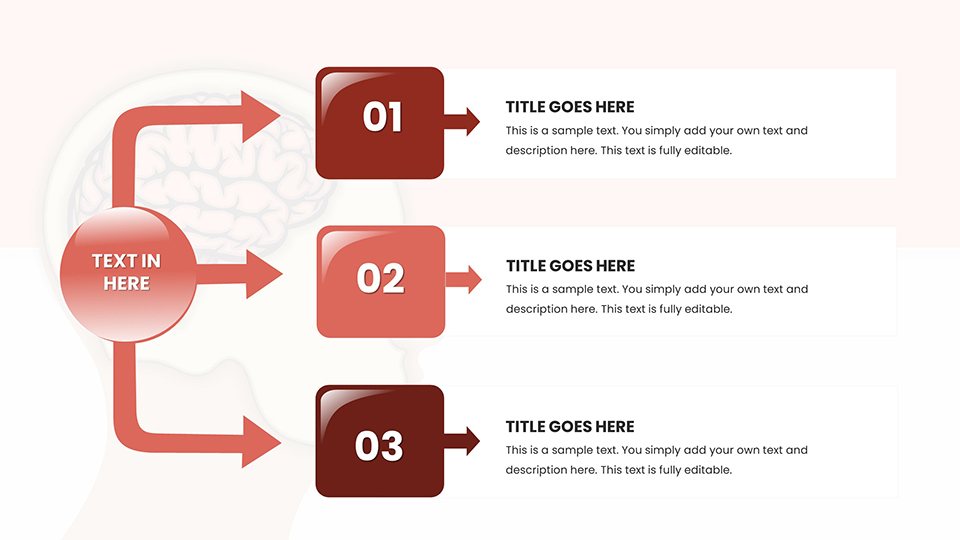
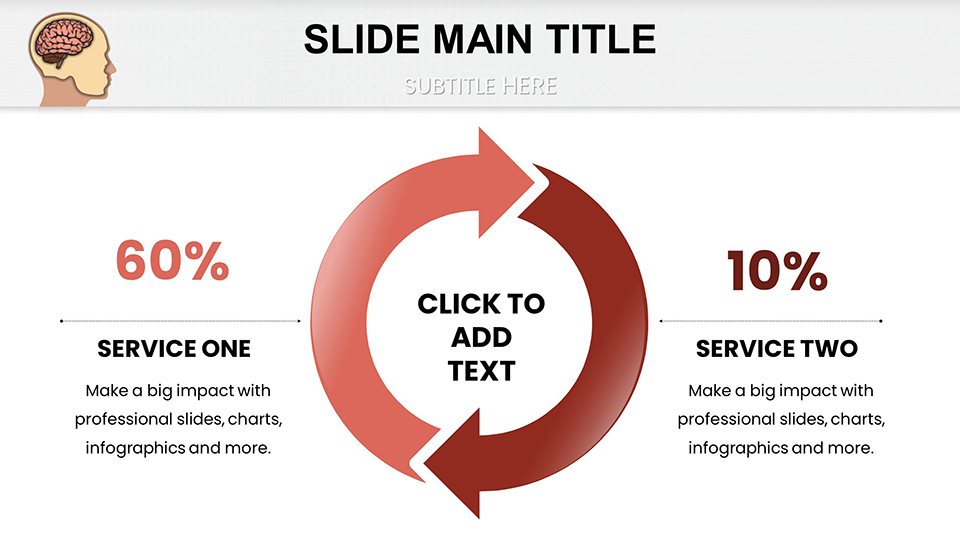
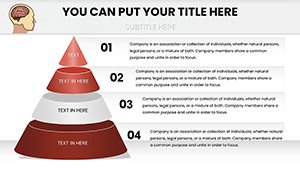
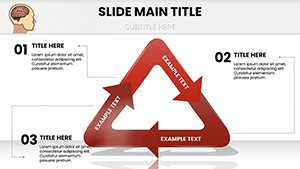
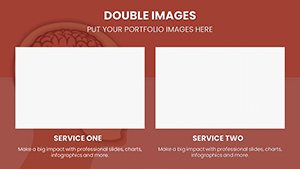
- Diverse Layouts: Includes pyramid charts for hierarchical brain functions and cycle diagrams for feedback loops in perception.
These address challenges like oversimplifying complex topics, turning abstract concepts into tangible visuals.
Applications Across Neurology and Education
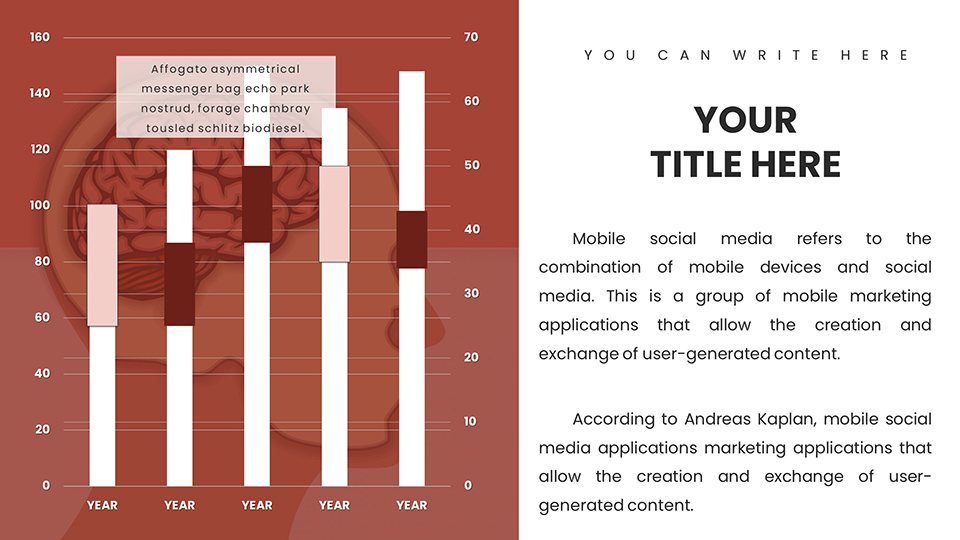
In medical training, utilize heatmap infographics to show brain activity during taste tests, referencing fMRI studies from the NIH. For public health campaigns, bar graphs can compare sensory loss in aging populations, promoting early interventions per AARP guidelines.
Educators can animate slides to demonstrate smell's link to memory, perhaps in a psychology class, leading to higher student engagement as seen in similar interactive tools. A fictional scenario: A researcher at a symposium used these infographics to explain multisensory integration, sparking collaborations and grant opportunities.
Step-by-Step Customization Process
- Begin with Basics: Open the template and select slides by sense category for targeted builds.
- Incorporate Data: Populate with stats from reliable sources, like WHO on sensory impairments.
- Refine Visuals: Tweak shapes and colors to emphasize key areas, like highlighting the thalamus in routing diagrams.
- Add Enhancements: Include tooltips or hyperlinks to deepen audience exploration.
- Test and Iterate: Preview in slideshow mode, adjusting for flow and impact.
Integrate with apps like Mentimeter for interactive polls on sensory experiences during presentations.
Superior to Generic Infographic Tools
Basic PowerPoint lacks the thematic depth here - think specialized radial charts for 360-degree sensory views versus flat defaults. This template outperforms by offering neurology-focused precision, potentially increasing audience comprehension by weaving in terms like "sensory cortex mapping" or "perceptual illusion graphics."
Ready to illuminate the wonders of the senses? Download and customize this template to elevate your next brain-focused session.
Frequently Asked Questions
How detailed are the infographics?
They cover brain-senses interactions with editable layers for in-depth or simplified views.
Compatible with older PowerPoint versions?
Yes, works with PowerPoint 2010 and later, plus Google Slides.
Suitable for virtual reality demos?
While not VR-native, slides can be exported for VR tools showcasing sensory simulations.
Can I add animations?
Absolutely - built-in support for animating neural pathways.
Any medical accuracy guarantees?
We base designs on established science; always verify with current research.