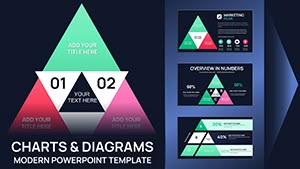
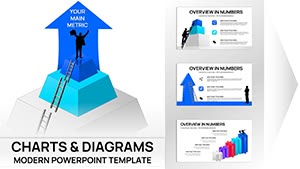
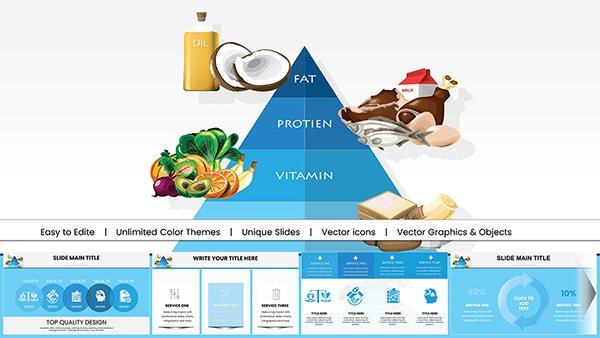
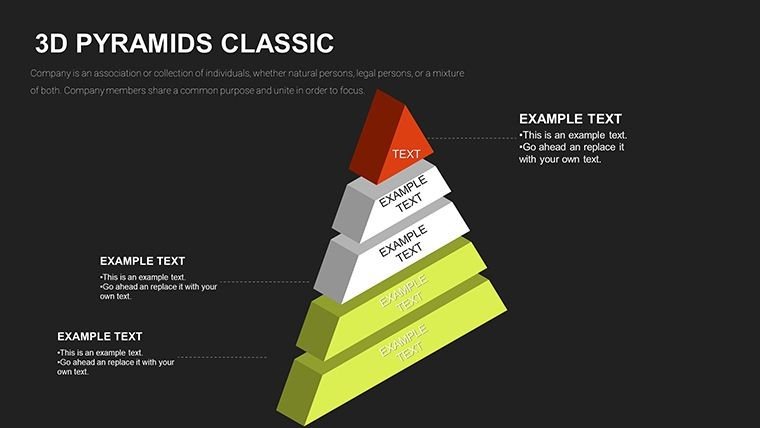
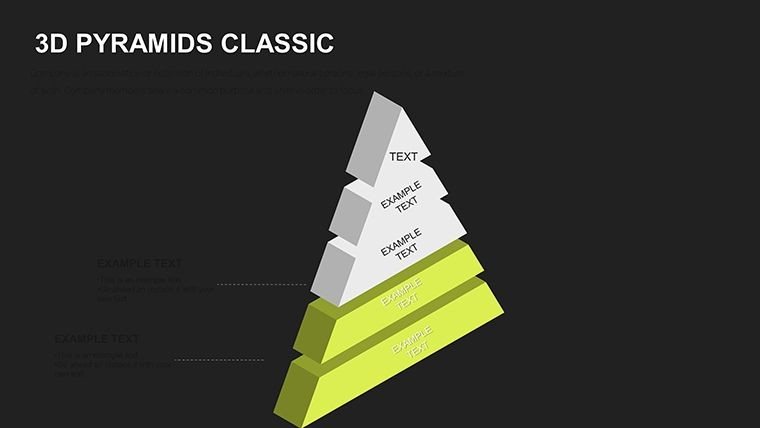
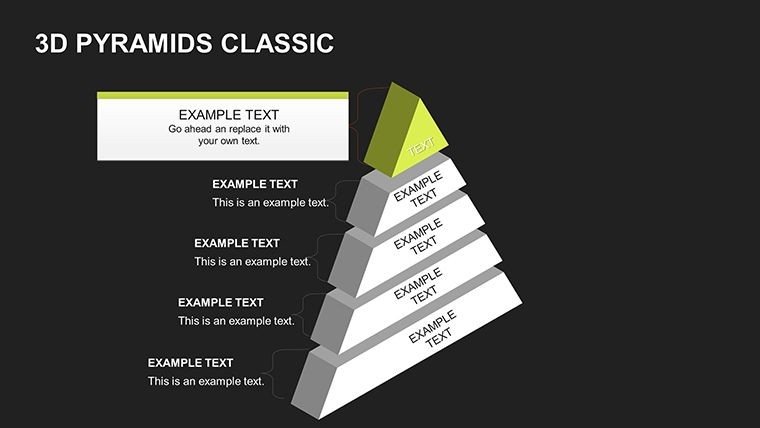
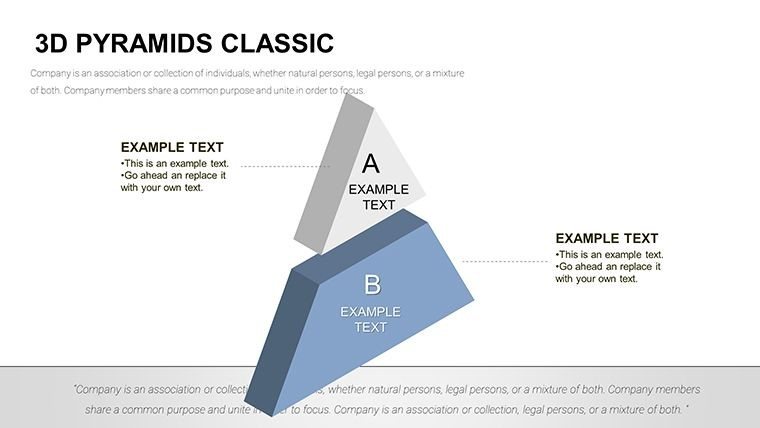
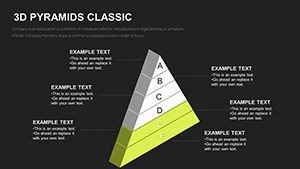
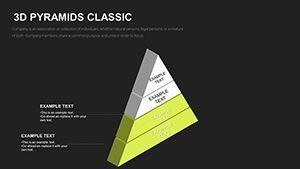
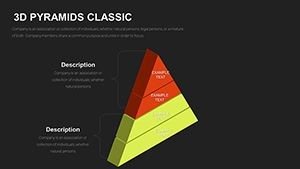
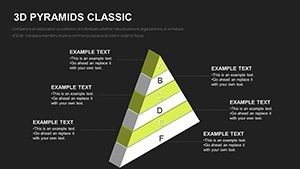
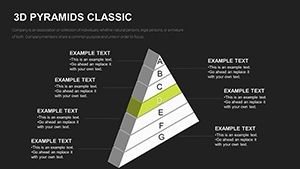
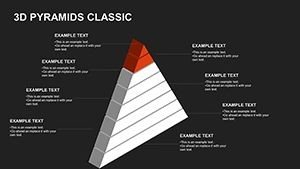
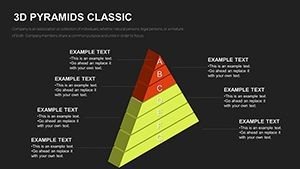
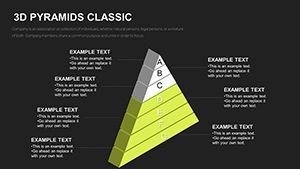
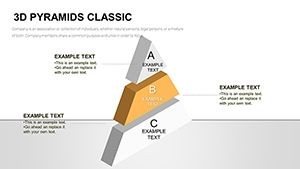
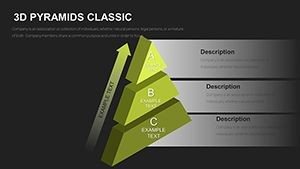
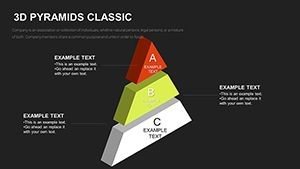
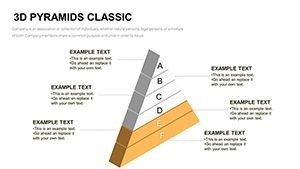
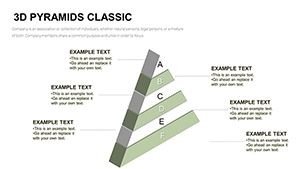
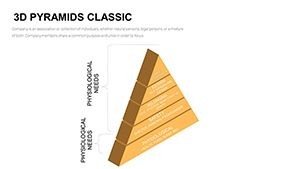
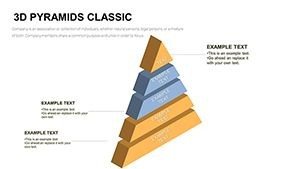
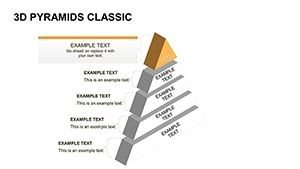
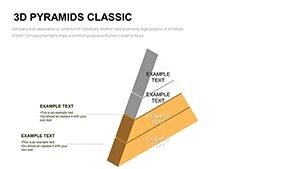
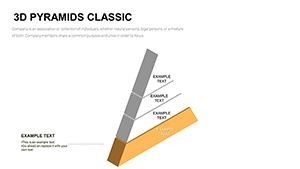
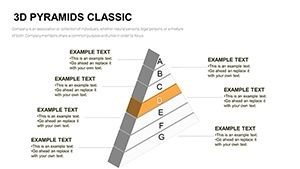
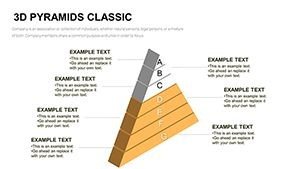
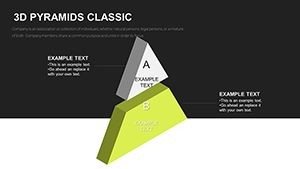
Infographic 3D Pyramids PowerPoint Charts Template


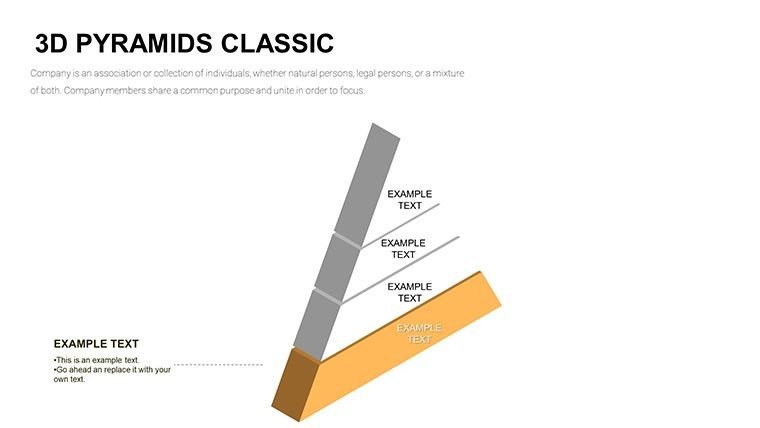


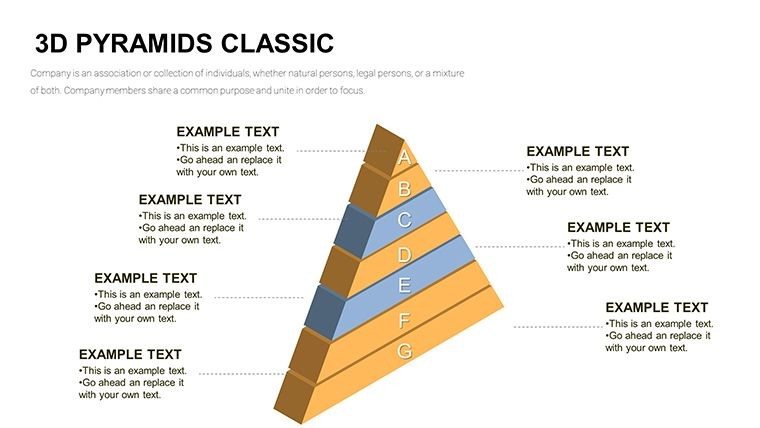

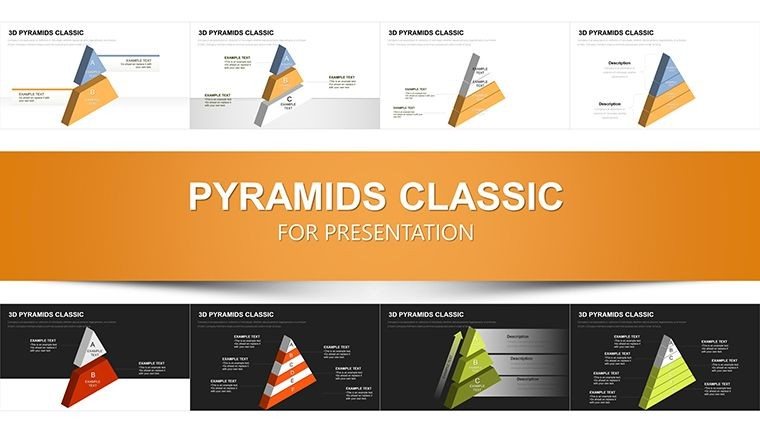


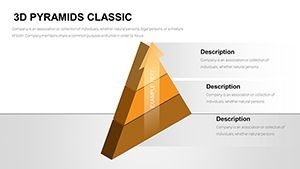


Having designed presentations for C-level executives in Fortune 500 companies, I know the power of visuals that pop off the slide. This Infographic 3D Pyramids PowerPoint Charts Template, with its 57 editable slides, is my go-to for adding dimension to flat data. It transforms hierarchies into immersive stories, using 3D effects to highlight progressions from base foundations to summit achievements. I`ve deployed it in boardrooms to outline merger strategies or in workshops to map educational curricula, always resulting in sharper audience engagement and faster comprehension.
Grounded in visualization best practices from experts like Edward Tufte, this template avoids the pitfalls of standard 2D charts by incorporating rotation, layering, and thematic icons. It`s ideal for professionals who present weekly, saving time on custom builds while delivering a polished, memorable impact. Whether depicting organizational charts in business or phased developments in architecture, it ensures your message stands tall, fostering alignment and inspiring action among stakeholders.
Core Features Driving Visual Excellence
This template`s strength lies in its detailed, user-centric design elements, each crafted to enhance storytelling in diverse scenarios.
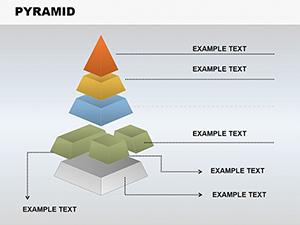
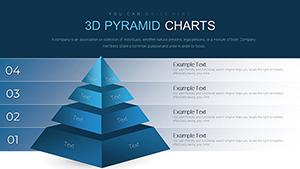
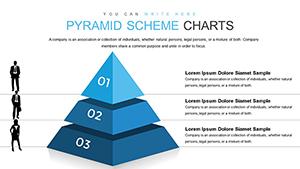
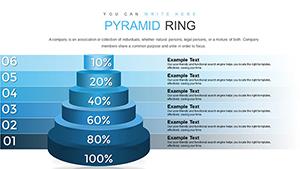
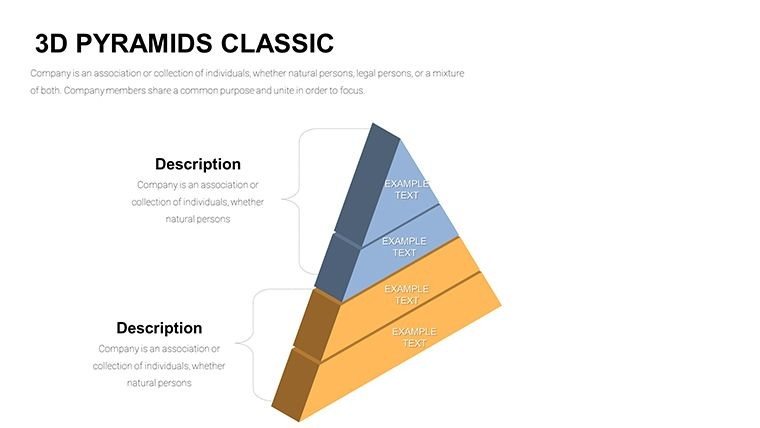
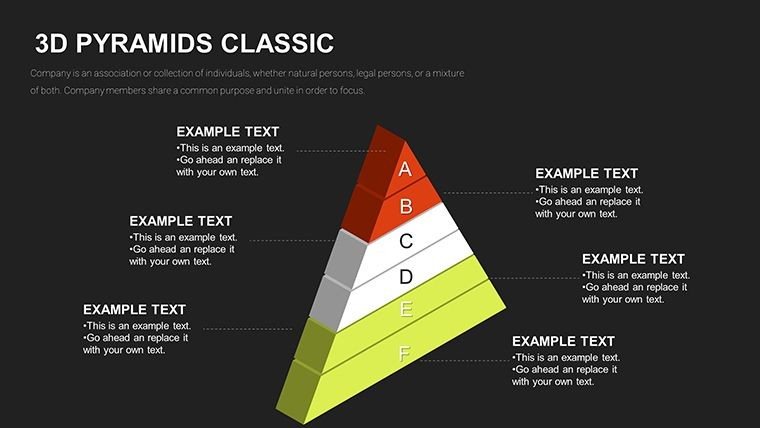
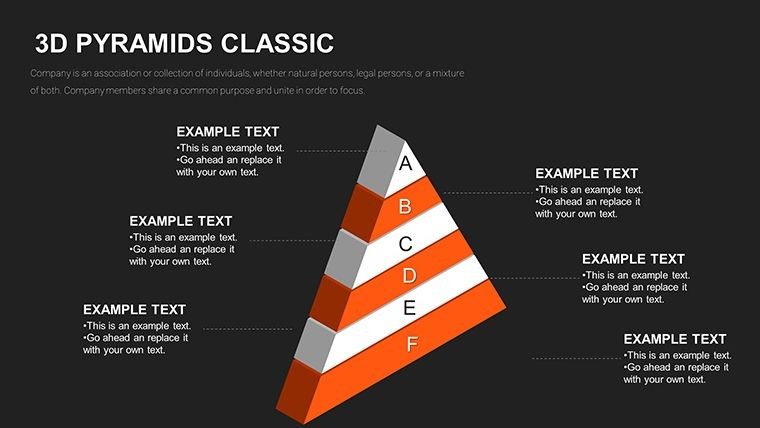
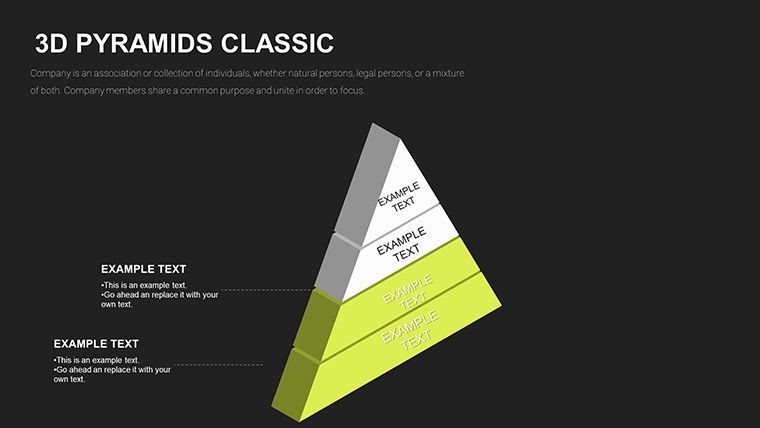
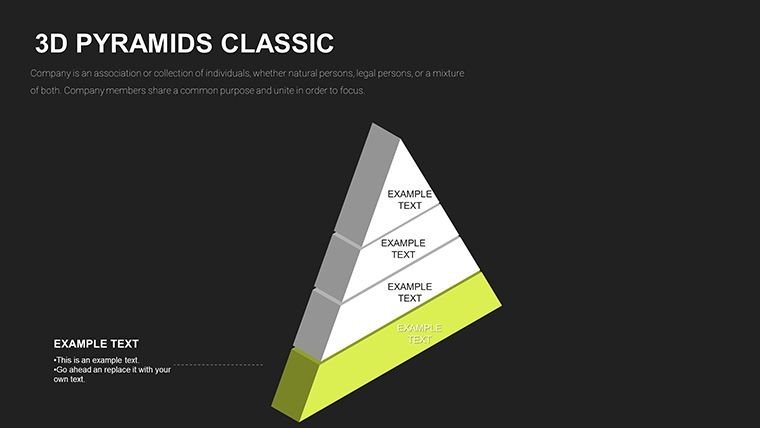
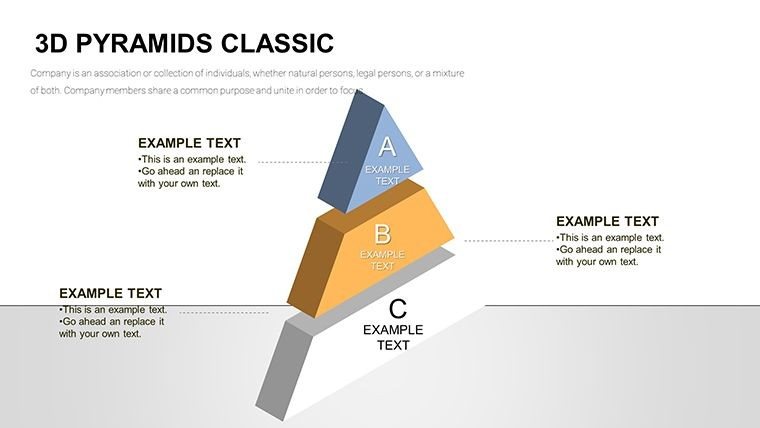
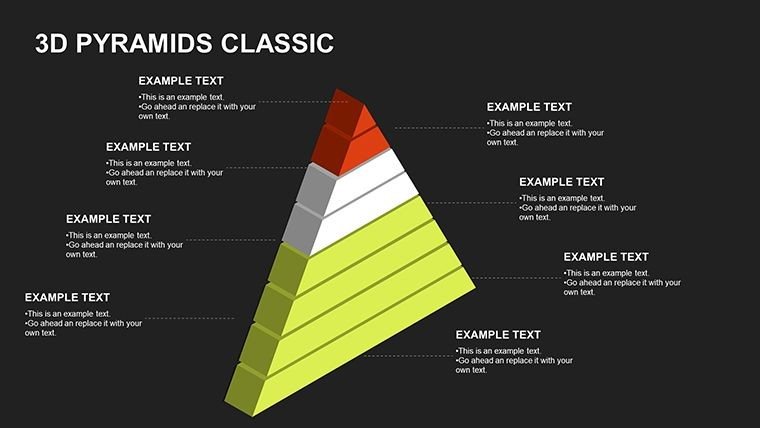
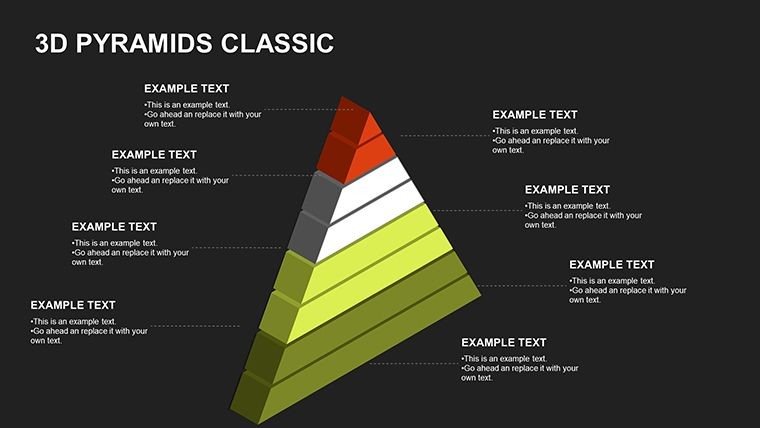
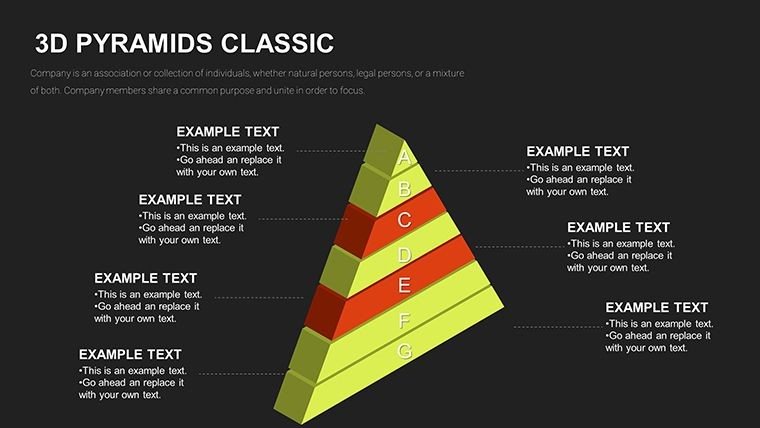
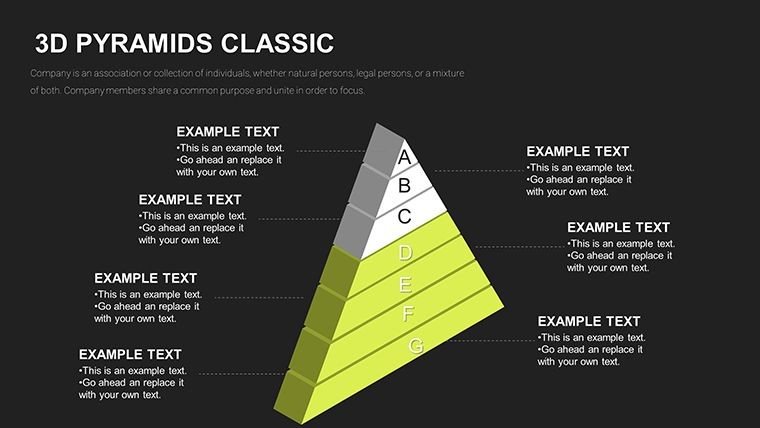
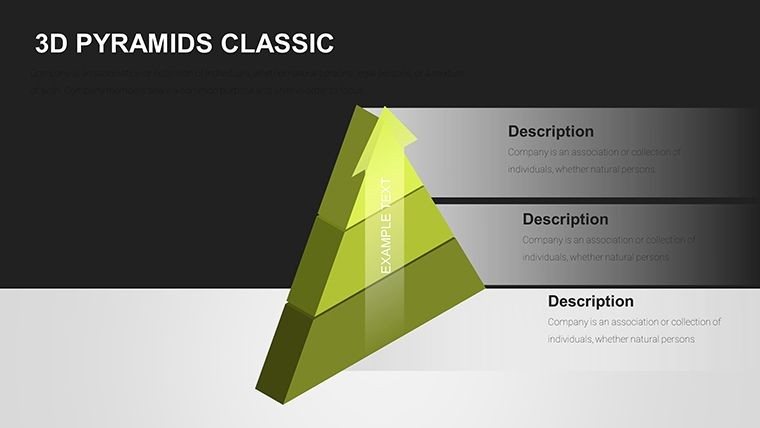
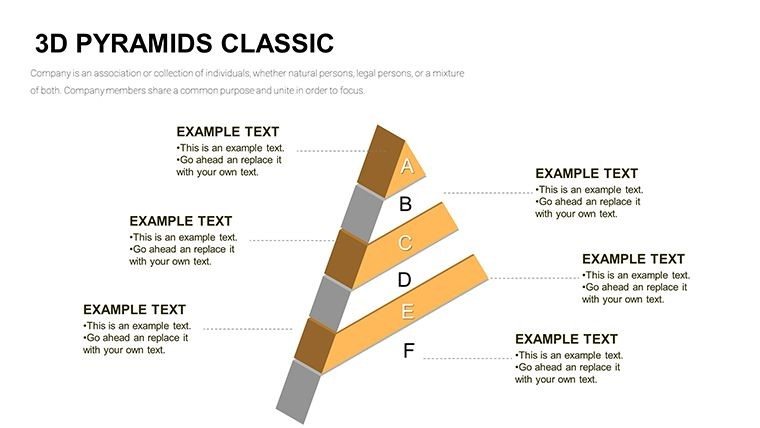
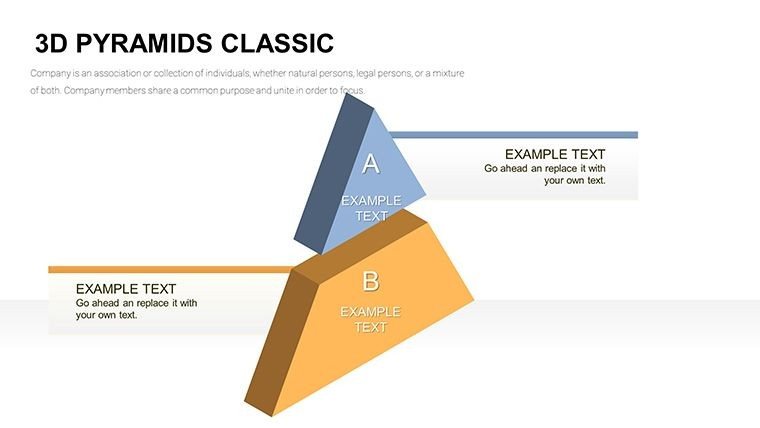
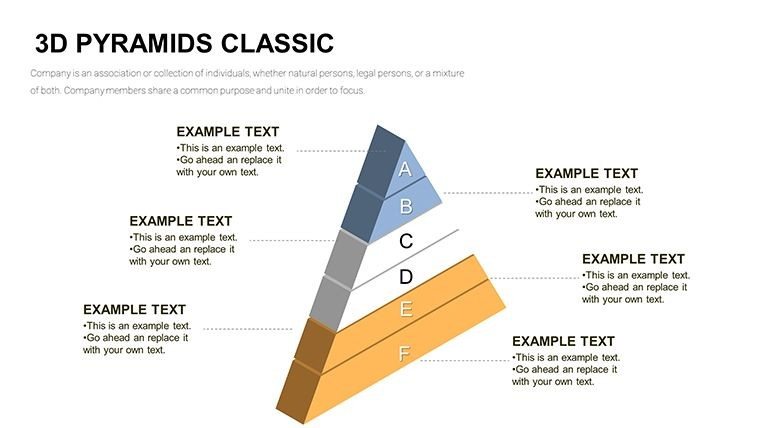
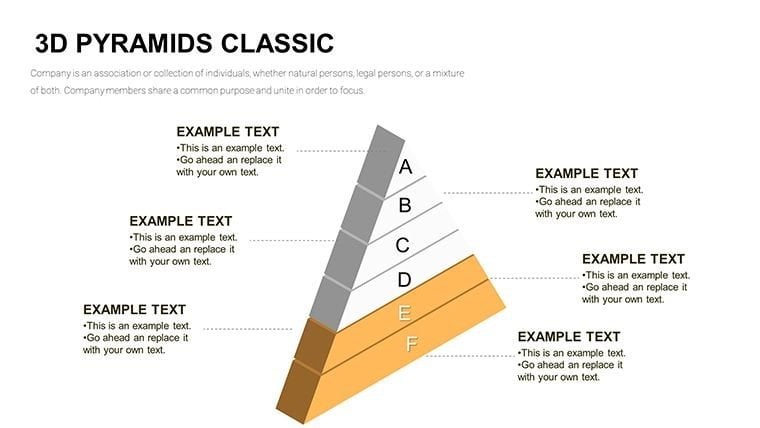
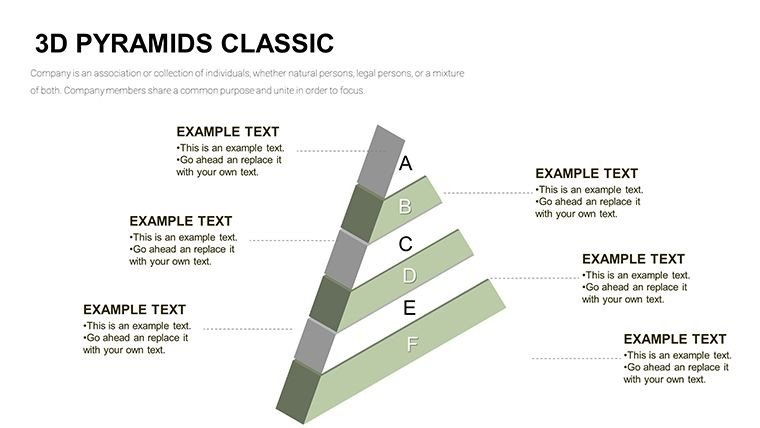
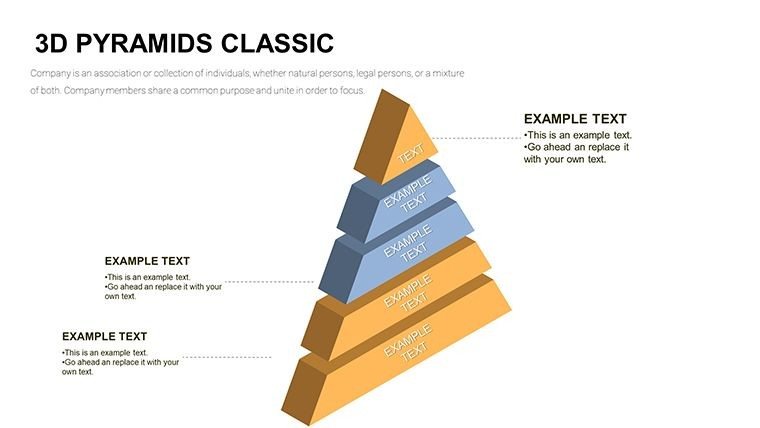
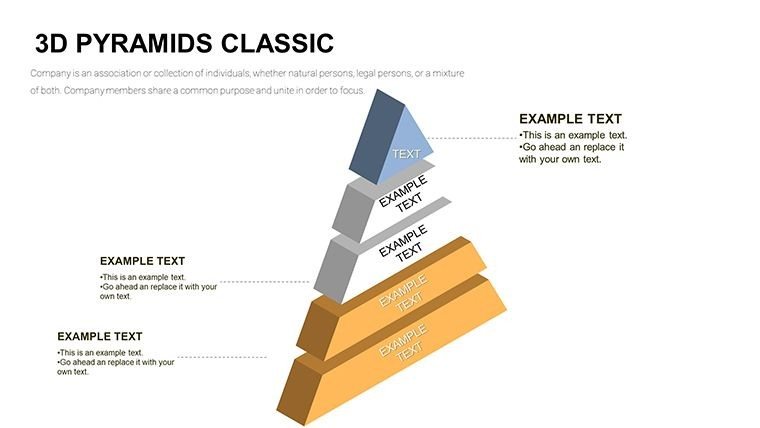
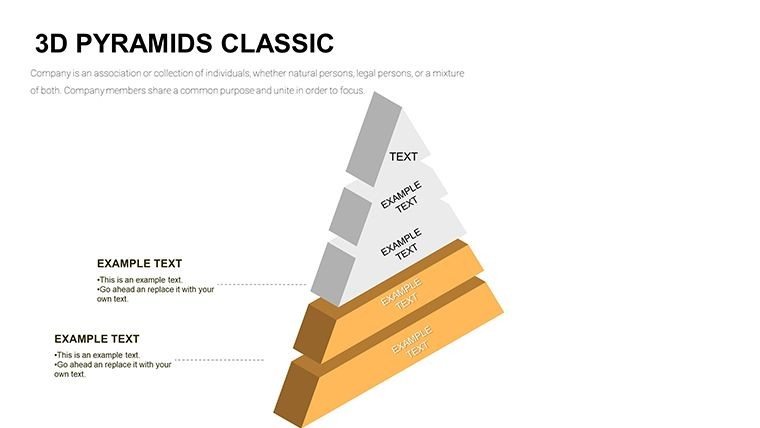
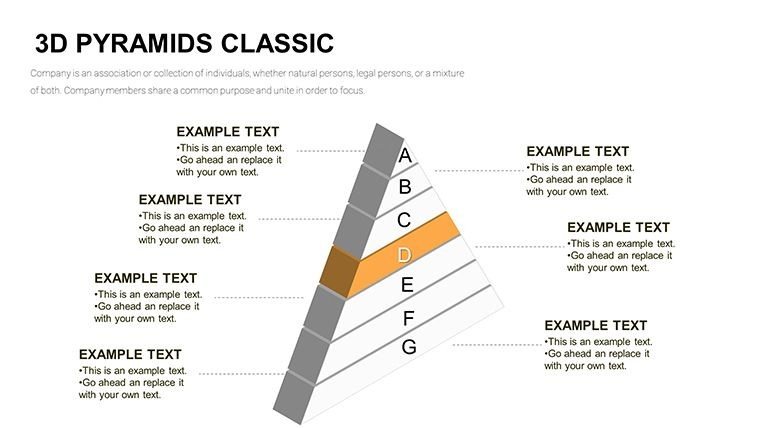
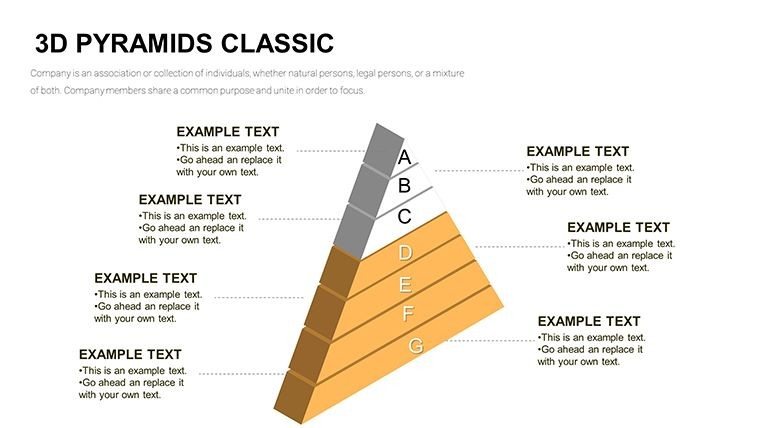
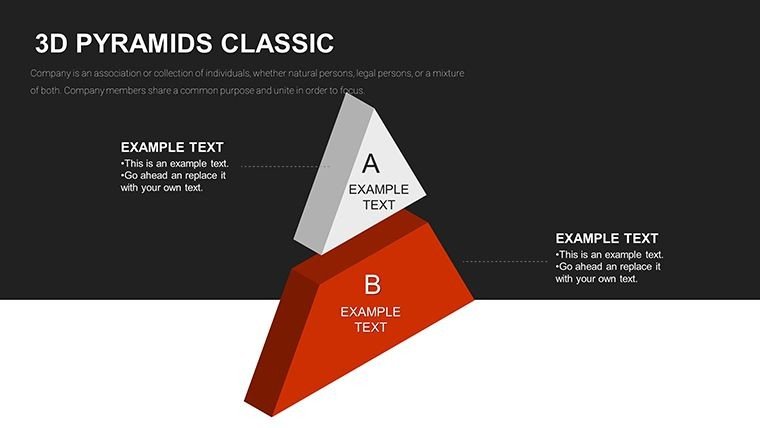
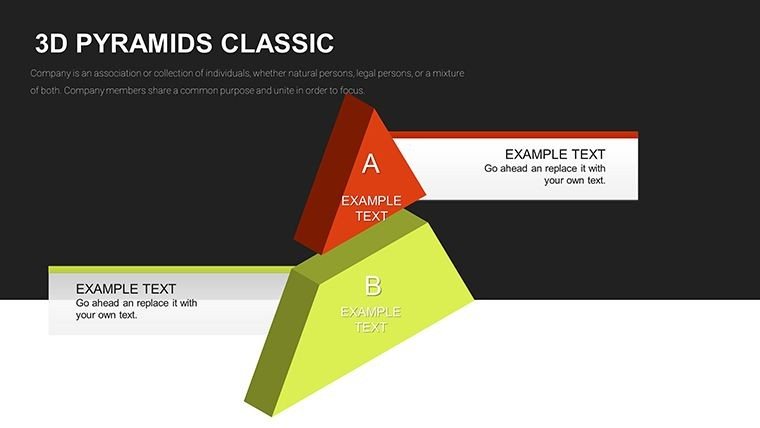
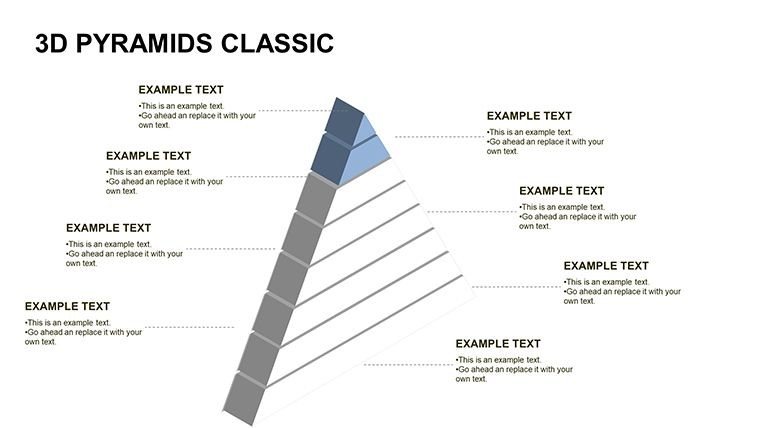
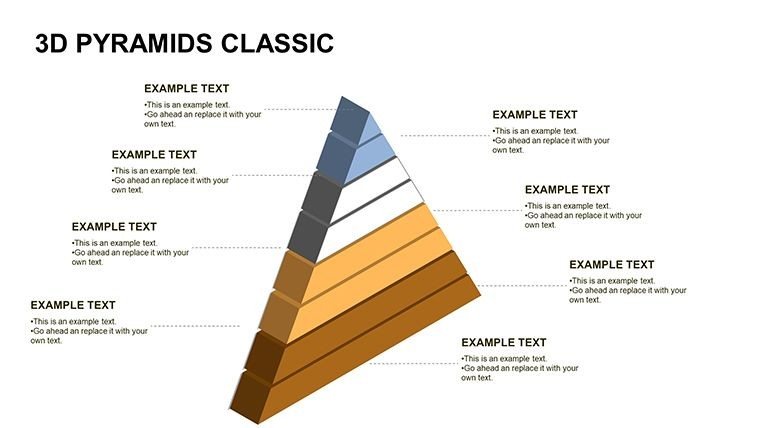
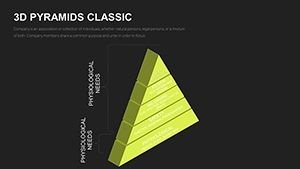
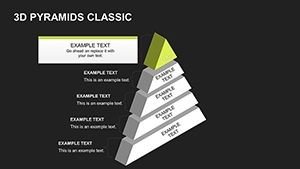
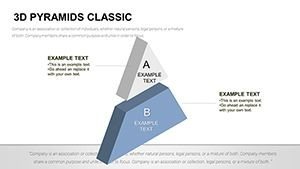
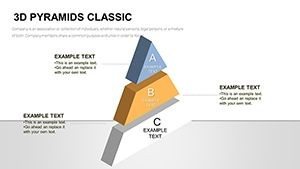
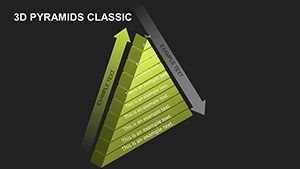
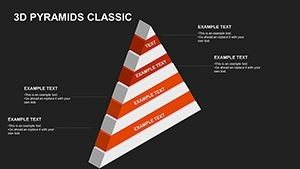
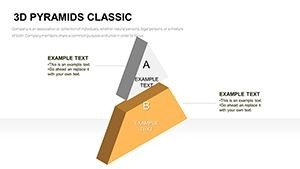
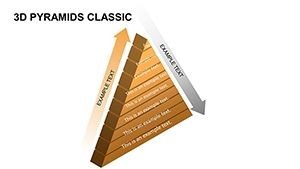
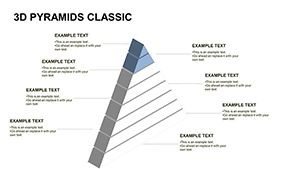
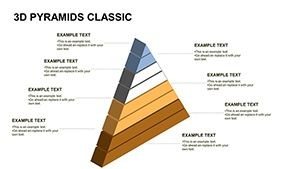
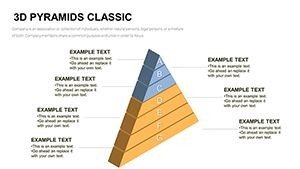
- 3D Rotation and Layering: Rotate pyramids for multi-angle views, layering elements to reveal insights progressively, perfect for detailing strategy evolutions.
- Complete Editability: Tweak every aspect - from gradients to text - for rapid adaptations during tight deadlines.
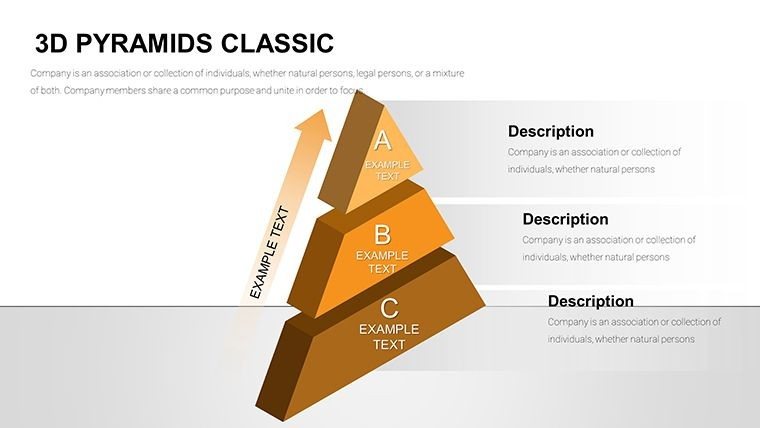
- Thematic Icons and Graphics: Built-in assets ensure consistency, like using gear icons for process flows in manufacturing pitches.
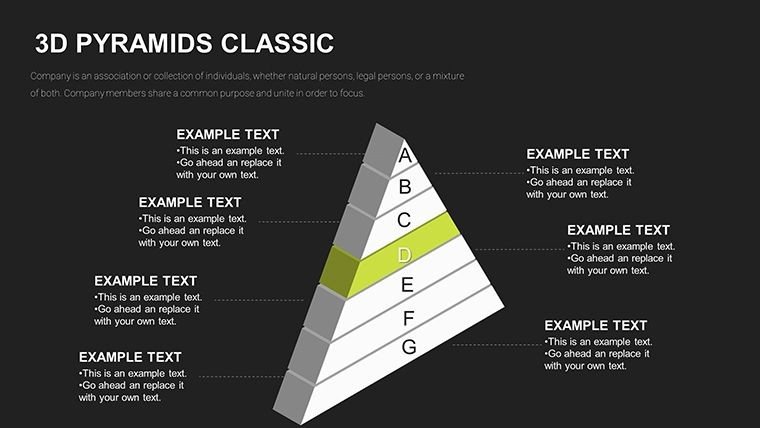
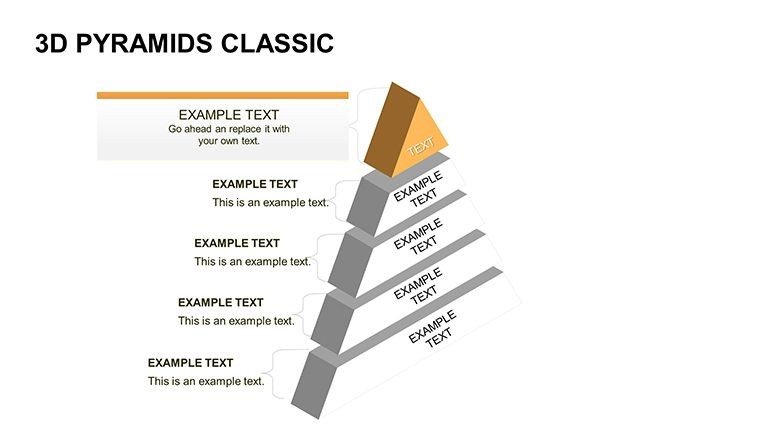
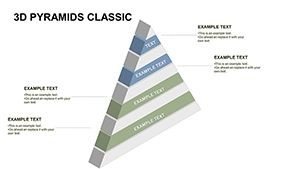
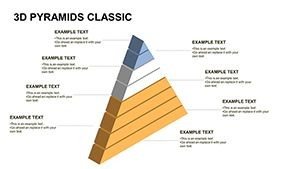
- Versatile Slide Options: Choose from hierarchical setups to flow diagrams, suiting sales forecasts or training modules.
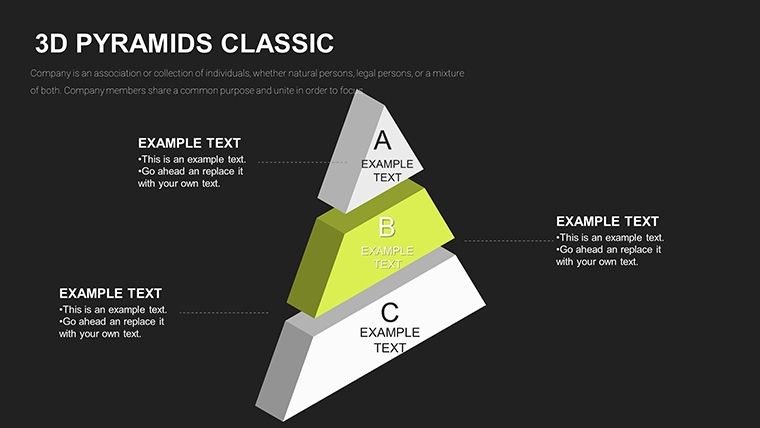
- High-Resolution Exports: Maintain crisp quality for digital shares or prints, essential for large-audience events.
- Animation Controls: Customize timings for paced reveals, keeping viewers hooked without overwhelming them.
In my hands-on experience, these features turn routine slides into strategic assets, streamlining revisions and boosting overall deck quality.
Professional Applications in Action
This 3D template excels across sectors where hierarchies matter. Business leaders use it for org charts in annual reviews, educators for timeline breakdowns in history classes, marketers for product launch roadmaps, and architects for site strategy overviews. Government analysts apply it to policy implementation tiers, while investors leverage it in due diligence presentations. Its adaptability makes it indispensable for anyone conveying structured information effectively.
Workflow Integration for Seamless Use
Incorporating this into your process is intuitive: Select a pyramid variant, populate with your data for auto-scaling, refine aesthetics to align with your brand, layer animations for narrative flow, and test across devices. Compatible with PowerPoint 2007 onward and Google Slides, it supports collaborative edits without quality loss. From my weekly builds, this approach minimizes errors and maximizes impact, especially in iterative client feedback loops.
Practical Examples from Client Engagements
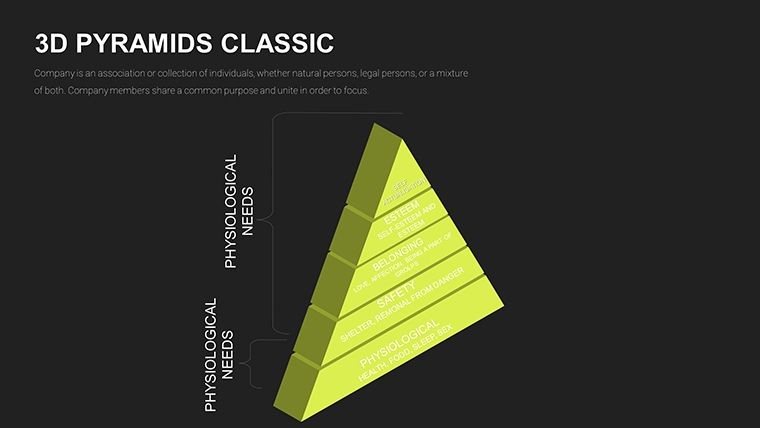
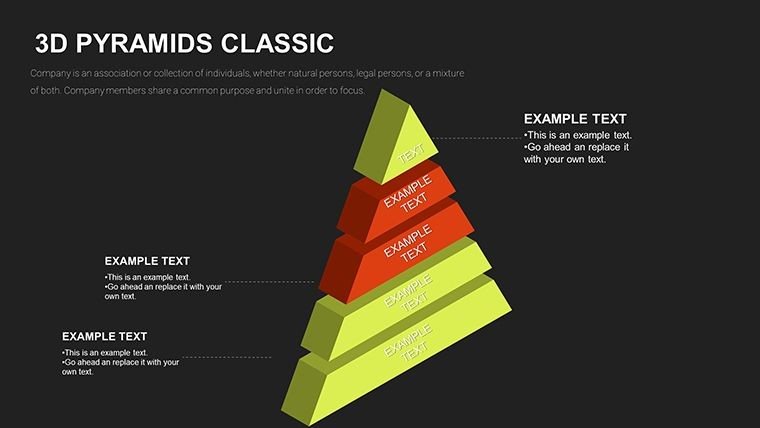
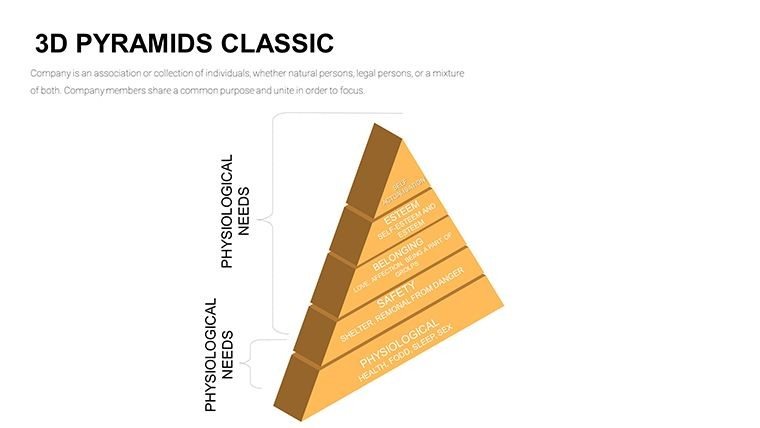
Imagine a marketing director pitching a growth strategy: The 3D pyramid bases on market analysis, mid-layers on tactics, and apex on projected ROI, with rotations showing interconnections. A teacher in a professional development seminar uses it to illustrate learning pyramids, from basic skills to advanced applications. A founder presenting to VCs maps startup milestones in 3D, emphasizing scalable growth. Consultants for mergers deploy it to visualize integration phases, from due diligence to synergy realization. These scenarios, pulled from my portfolio, have driven successful outcomes like funding rounds and contract wins.
Template vs. Standard PowerPoint: A Side-by-Side
| Feature | This 3D Template | Default PowerPoint |
|---|---|---|
| Dimensional Effects | True 3D rotation and depth for immersive visuals | Limited to 2D shapes, no built-in 3D |
| Editability | Full customization of all elements in 57 slides | Basic modifications, time-consuming setups |
| Engagement Tools | Integrated animations and icons for storytelling | Generic effects lacking cohesion |
| Export Quality | High-res for professional outputs | Standard, prone to distortion |
| Accessibility | WCAG-compliant contrasts and tooltips | Requires manual adjustments |
Such contrasts explain why I favor this for demanding clients - it simply outperforms basics in every metric.
Industry-Specific Use Cases
Tailored for varied fields, in healthcare it charts patient care hierarchies from diagnosis to recovery. Tech firms use it for software development lifecycles, base for coding and top for deployment. In finance, it visualizes investment pyramids from risk assessment to returns. Retail managers apply it to supply chain structures, educators to curriculum progressions, and non-profits to program impact layers. Each application I`ve implemented underscores its role in clarifying complex systems across 2024-2025 trends like hybrid work and data-driven decisions.
Consider adding this to your toolkit for presentations that truly stand out.
Frequently Asked Questions
How flexible are the 3D elements for resizing?
Extremely - scale layers without distortion, ideal for adapting to different slide focuses.
Does it support collaborative editing?
Yes, via Google Slides compatibility, allowing real-time team inputs.
Can I incorporate custom graphics?
Certainly, insert and align your icons seamlessly with the 3D designs.
What PowerPoint versions work best?
From 2007 onward, with optimal performance in recent editions.
How to optimize for audience recall?
Use layered animations and thematic colors to reinforce key points effectively.
Is it suitable for print materials?
Absolutely, high-res exports ensure clarity in handouts or reports.
Secure your copy of this 3D Pyramids Template now and elevate your hierarchical presentations to new heights.