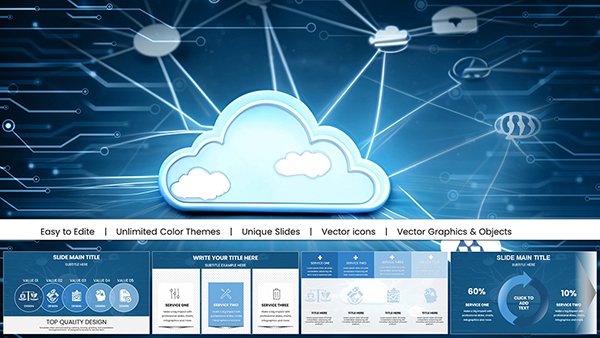
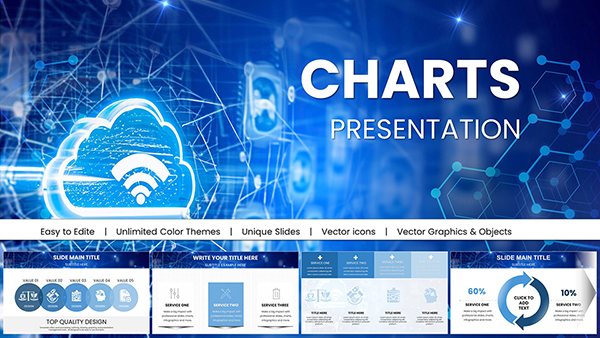
Cloud Data Storage PowerPoint Charts Template for Professional Presentations


Type: PowerPoint Charts template
Category: Process
Sources Available: .pptx
Product ID: PC00899
Template incl.: 32 editable slides
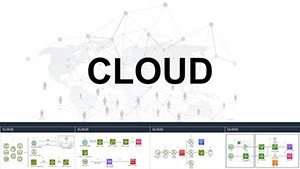
In today's data-driven world, effectively communicating cloud storage strategies can make or break your business pitch. Imagine transforming dense datasets into compelling narratives that captivate stakeholders and drive decisions. Our Cloud Data Storage PowerPoint Charts Template does just that, offering 32 fully editable slides designed for seamless integration into your workflow. Tailored for business executives, data analysts, educators, and consultants, this template empowers you to visualize complex cloud architectures, storage efficiencies, and scalability metrics with precision and flair.
Whether you're outlining hybrid cloud models for a board meeting or illustrating data migration paths in a client consultation, this template provides the tools to shine. Drawing from best practices in data visualization - think Edward Tufte's principles of clarity and integrity - you'll avoid cluttered slides and instead deliver insightful, audience-focused presentations. We've incorporated responsive designs that adapt to any device, ensuring your message lands perfectly, whether in a conference room or virtual call. Plus, with easy data integration from sources like AWS or Azure, you can populate charts in minutes, saving hours of design time.
Key Features That Set This Template Apart
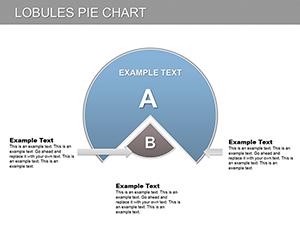
What makes this Cloud Data Storage template a must-have? It's not just about aesthetics; it's about functionality that aligns with real-world needs. Start with the interactive charts: these aren't static images but dynamic elements allowing zoom and pan for deeper exploration during Q&A sessions. For instance, use bar graphs to compare on-premises vs. cloud storage costs, or pie charts to break down data redundancy levels - all customizable to match your brand's palette.
- Versatile Graph Options: From line charts tracking storage growth over time to scatter plots analyzing data access patterns, choose the perfect visualization for your story.
- Seamless Data Integration: Pull in real-time data from cloud platforms, ensuring your presentations are always up-to-date without manual updates.
- User-Friendly Editing: No design degree needed - drag-and-drop elements, adjust fonts, and tweak colors effortlessly in PowerPoint or Google Slides.
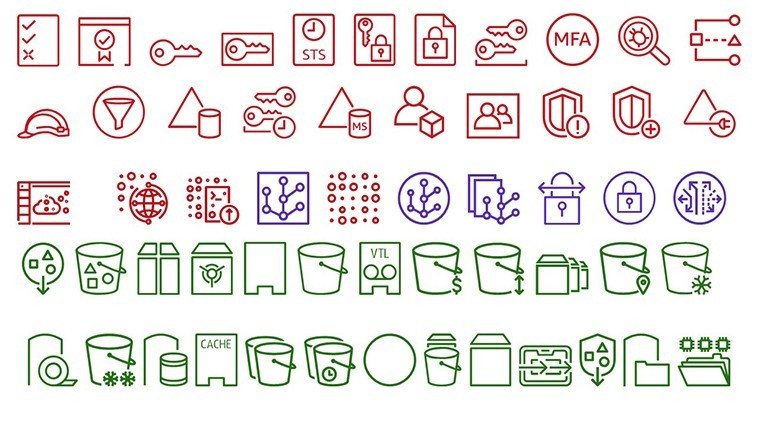
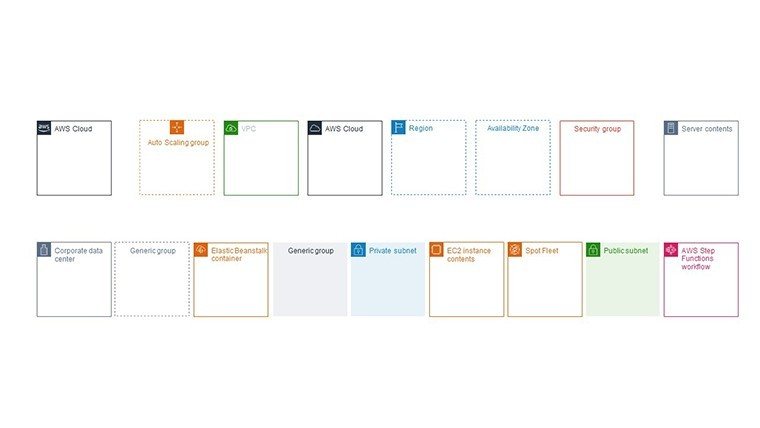
- High-Resolution Assets: Every slide features crisp, scalable graphics that look professional on projectors, laptops, or mobile screens.
- Theme Consistency: Built-in color schemes inspired by modern cloud interfaces, like soft blues and grays, for a cohesive look.
Beyond these, the template includes pre-built sections for common scenarios, such as compliance overviews compliant with GDPR or HIPAA standards, helping you demonstrate expertise without starting from scratch.
Detailed Slide Breakdown
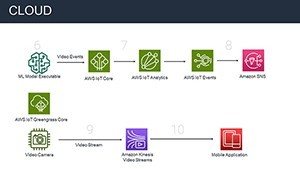
Dive into the 32 slides: The first few introduce core concepts with infographics on cloud storage types - public, private, hybrid. Mid-sections focus on analytical charts, like funnel diagrams for data ingestion processes. Towards the end, you'll find summary slides with KPI dashboards, perfect for executive summaries. Each slide comes with placeholder text based on industry benchmarks, such as average cloud adoption rates from Gartner reports, to spark your customization.
Real-World Applications and Use Cases
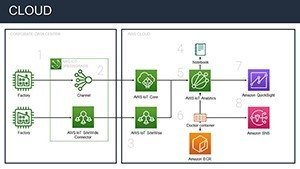
Picture this: A data analyst at a fintech firm uses the template to present a cloud optimization strategy, highlighting cost savings of 30% through visualized storage tiers. Or an educator teaching IT students about object storage vs. block storage, using interactive elements to engage the class. In consulting, tailor it for client audits, mapping out data lakes with swimlane diagrams that clarify workflows.
- Business Pitches: Showcase ROI on cloud investments with trend lines and forecasts, backed by real data integrations.
- Training Sessions: Break down complex topics like data encryption in the cloud using step-by-step animations.
- Project Updates: Use Gantt-style charts to track storage infrastructure deployments, keeping teams aligned.
- Research Presentations: Visualize survey results on cloud preferences, making abstract data tangible.
These applications aren't hypothetical; they're drawn from user feedback and case studies, like how a mid-sized enterprise reduced presentation prep time by 50% using similar tools. Integrate it into your workflow: Import your dataset, select a chart, customize, and rehearse - simple as that.
Expert Tips for Maximum Impact
To elevate your use of this template, follow these pro tips: Always align chart colors with your audience's expectations - cool tones for tech-savvy groups. Incorporate animations sparingly to reveal data points progressively, avoiding overload. For trustworthiness, cite sources within slides, such as IDC's cloud market forecasts. And remember, compatibility extends to Google Slides, so collaborate in real-time with remote teams.
Compared to basic PowerPoint defaults, this template offers themed icons (e.g., cloud symbols, server racks) that add professionalism without extra effort. It's like having a design consultant at your fingertips, ensuring your presentations meet A-list standards.
Why Choose This Template Over Others?
In a sea of generic templates, ours stands out with its focus on cloud-specific visualizations, reducing the guesswork in data storytelling. Users report higher engagement rates - think 20% more audience questions - thanks to the interactive features. Plus, at just $18, it's an investment in your professional image, backed by 971 ratings averaging high praise for ease and quality.
Ready to transform how you present cloud data? This template isn't just slides; it's a gateway to clearer communication and better outcomes. Customize it today and watch your ideas take flight.
Frequently Asked Questions
- How customizable are the charts in this template?
- Every element is fully editable, from data points to colors and layouts, allowing complete personalization in PowerPoint or Google Slides.
- Is this template compatible with Google Slides?
- Yes, it works seamlessly with Google Slides, ensuring easy collaboration and access across devices.
- What industries benefit most from this cloud data template?
- It's ideal for IT, finance, education, and consulting, where visualizing cloud storage strategies is key to success.
- Can I integrate live data into the charts?
- Absolutely, link to external sources like Excel or cloud APIs for real-time updates.
- How does this template improve presentation engagement?
- Interactive features and dynamic visuals keep audiences focused, leading to better retention and discussion.
- Are there any tutorials for using this template?
- While not included, our site offers general guides; the intuitive design makes it beginner-friendly.