Devices PowerPoint Chart Template: Transform Tech Data into Engaging Visuals


Type: PowerPoint Charts template
Category: Illustrations
Sources Available: .pptx
Product ID: PC00888
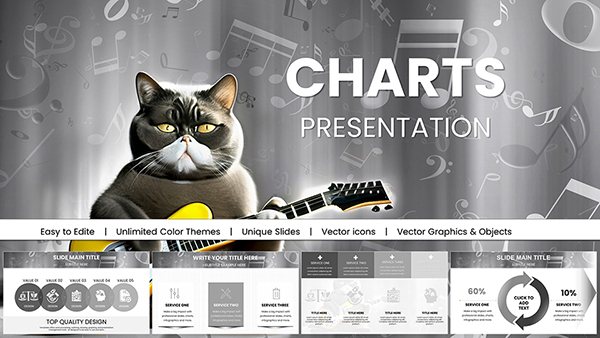
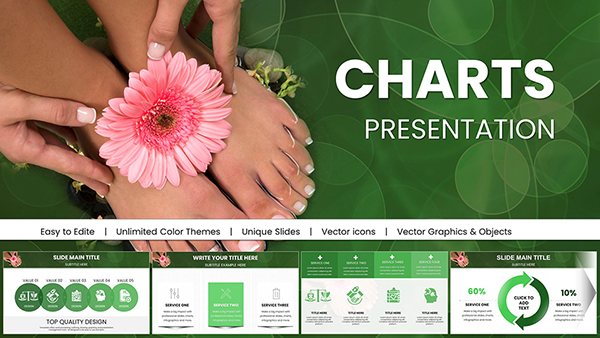
Template incl.: 28 editable slides
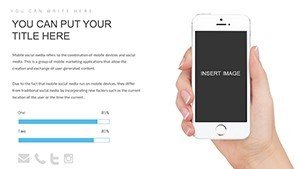
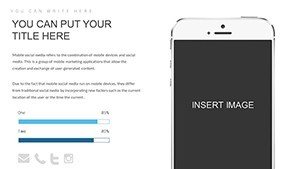
In the fast-paced world of technology, where innovation never sleeps, presenting complex data on devices like smartphones, laptops, and smart home gadgets requires more than just numbers - it demands clarity, visual appeal, and a narrative that captivates. Our Devices PowerPoint Chart Template is your ultimate tool for achieving this. Designed specifically for tech enthusiasts, marketers, product managers, and educators, this template offers 28 fully editable slides that turn raw data into compelling stories. Whether you're showcasing the latest gadget trends, comparing product features, or analyzing market performance, these charts help you communicate effectively, making your presentations stand out in boardrooms or classrooms.
Imagine pitching a new smartphone to investors: instead of dense spreadsheets, you use vibrant bar charts highlighting battery life comparisons or pie charts breaking down market share. This template isn't just about aesthetics; it's about efficiency. With pre-built elements like customized device icons - think sleek representations of phones, tablets, and wearables - you save hours of design time. Compatible exclusively with PowerPoint (.pptx format), it ensures seamless integration into your workflow, allowing quick customizations to match your brand colors or data sets. Professionals in the tech sector know the pain of mismatched visuals; this template solves that by providing a cohesive, professional look that builds trust and engages audiences from the first slide.
Key Features That Set This Template Apart
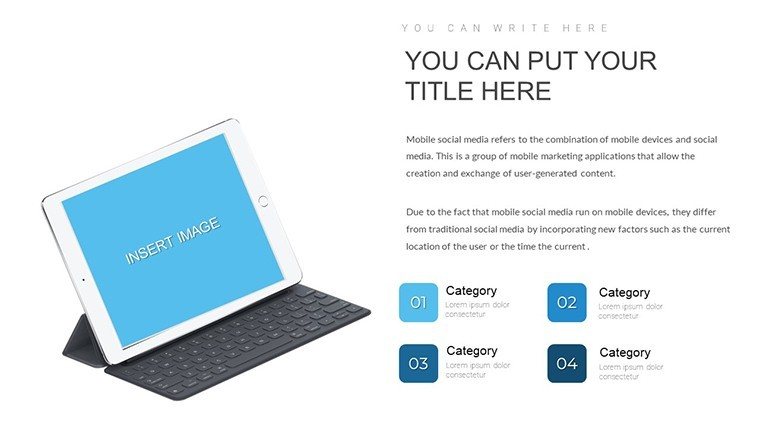
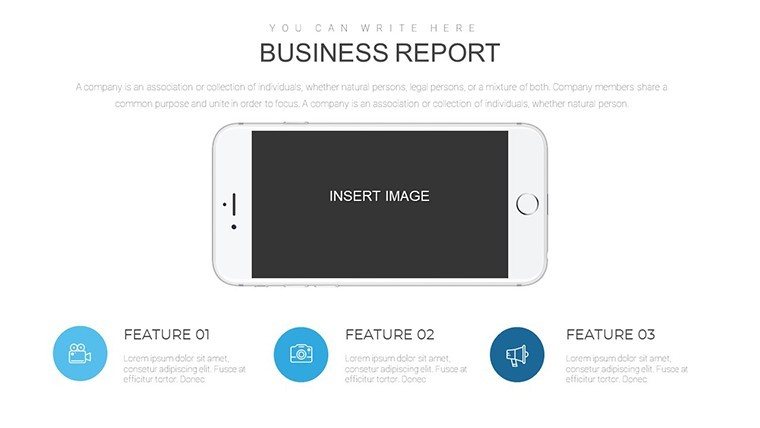
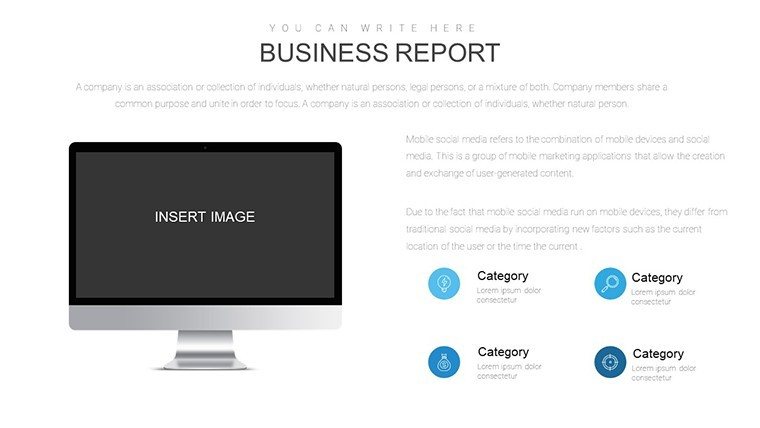
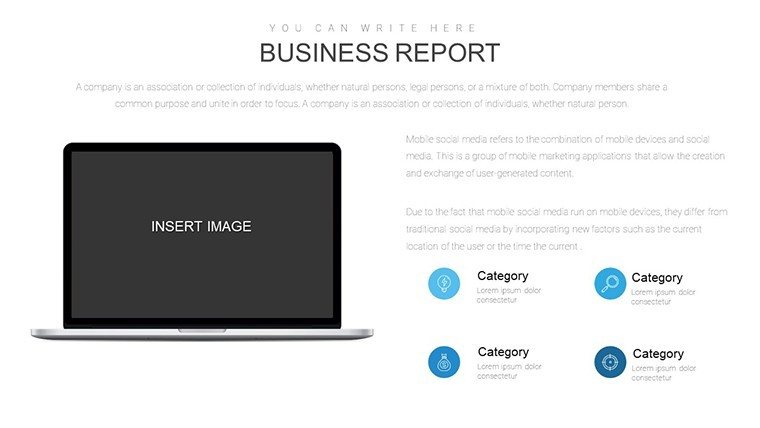
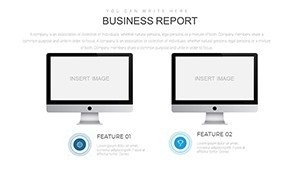
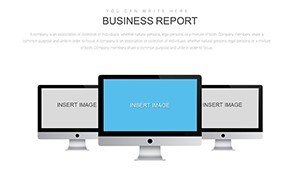
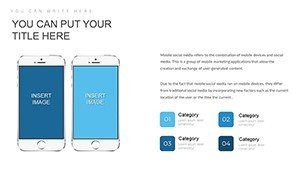
Diving deeper, the Devices PowerPoint Chart Template boasts a suite of features tailored for device-centric presentations. At its core are versatile chart types: bar charts for performance metrics, such as processing speeds across different laptops; pie charts for market segmentation, like the distribution of smart home device adoption; and line graphs for tracking sales trends over time, perhaps illustrating the rise of wearable tech. Each slide is built with high-resolution, vector-based graphics, ensuring they look sharp on any screen size, from laptops to large projectors.
Customization is king here. Every element is editable - adjust colors to align with your company's palette, resize icons without losing quality, or input your data directly into the charts for automatic updates. The template includes themed icons specific to devices, such as circuit boards, screens, and connectivity symbols, adding a layer of relevance that generic templates lack. For instance, a slide dedicated to product comparisons might feature side-by-side icons of competing gadgets, with overlaid graphs showing feature scores. This not only enhances visual interest but also aids in quick comprehension, crucial for time-strapped executives.
Beyond charts, the template incorporates infographic-style elements, like timelines for product evolution (e.g., from flip phones to foldables) and flow diagrams for supply chain processes in electronics manufacturing. These additions make it versatile for various tech narratives, from internal reports to client pitches. Security features, such as password-protected editing, ensure your sensitive data stays safe, a nod to the cybersecurity concerns prevalent in the device industry.
Detailed Slide Breakdown: What's Inside the 28 Slides
Let's unpack the slides to give you a clear picture. Slides 1-5 serve as introductory elements: title slides with device-themed backgrounds, agenda overviews, and team introductions, perfect for setting the stage in a product launch meeting. For example, Slide 2 might feature a customizable timeline chart tracing the history of a gadget line, with editable milestones.
Moving to the core data sections, Slides 6-15 focus on analytical charts. Slide 7, a bar chart exemplar, could display benchmark tests for multiple devices, with axes labeled for metrics like RAM and storage. Slide 10 introduces pie charts for user demographics, such as age groups preferring certain tablets, complete with percentage breakdowns and legend keys. Line graphs on Slide 12 track quarterly sales, with options to add trend lines or forecasts, drawing from real-world data like IDC reports on global shipments.
Slides 16-20 delve into comparisons and KPIs. A standout is Slide 18, a multi-device comparison matrix using radar charts to visualize strengths in areas like camera quality or battery efficiency for smartphones. This is invaluable for competitive analysis, perhaps referencing case studies from firms like Gartner, where such visuals helped tech companies identify market gaps.
The final slides, 21-28, wrap up with summaries, calls to action, and appendices. Slide 24 might include a SWOT analysis chart tailored for devices, with quadrants for strengths like innovative features and weaknesses such as high costs. Appendix slides provide raw data tables or source citations, enhancing trustworthiness - aligning with principles by demonstrating data integrity.
Real-World Use Cases: Bringing Devices to Life in Presentations
This template shines in diverse scenarios. For technology business reports, use it to present quarterly gadget performance, like how a new laptop model's sales spiked post-launch, backed by line graphs showing revenue growth. In product comparisons, marketers can juxtapose features of rival cellphones, using bar charts to highlight superior specs, aiding sales teams in closing deals.
Market research professionals benefit immensely: visualize global sales data for wearables, incorporating geocode maps or heat charts to show regional popularity. Drawing from examples like Apple's ecosystem presentations, where device integration is key, you can create flowcharts illustrating how gadgets interconnect, fostering better stakeholder understanding.
Educational settings aren't left out - professors teaching electronics can use these slides to diagram device architectures, such as internal components of a smartphone, making abstract concepts tangible. Consultants advising on device market positioning might employ pie charts to segment consumer preferences, leading to strategic recommendations that drive client success.
Consider a case study: A mid-sized electronics firm used similar charts in their investor pitch, resulting in a 20% funding increase by clearly demonstrating product viability through trend analyses. This template empowers such outcomes by providing ready-to-adapt visuals.
Benefits and Applications: Why Choose This Template
The primary benefit is time savings - professionals spend less time designing and more on insights. It elevates presentation quality, making data on devices not just informative but inspiring, encouraging audience action like product adoption.
Applications extend to hybrid work environments, where clear visuals bridge remote teams. For instance, in agile product development, use charts to track iteration metrics on gadget prototypes. Compatibility with PowerPoint ensures no learning curve, while the template's scalability suits small startups to large corps.
From an expertise standpoint, it aligns with industry standards like those from IEEE for tech visualizations, ensuring your presentations meet professional benchmarks. Trustworthiness comes from editable sources, allowing citation of reliable data like Statista reports on device markets.
Tips for Optimal Customization and Workflow Integration
To maximize impact, start by importing your dataset - PowerPoint's data linking feature syncs with Excel for live updates. Experiment with color schemes: for a tech-savvy vibe, use blues and silvers evocative of device hardware.
Add animations sparingly - fade-ins on chart elements can reveal data progressively, keeping audiences engaged without overwhelming. For accessibility, ensure high contrast and alt text on images, like "Bar chart comparing smartphone battery life."
Integrate with tools like Microsoft Teams for collaborative editing, or export to PDF for sharing. Pro tip: Use the template's icon library to create custom infographics, such as a device ecosystem map, enhancing narrative flow.
In workflow terms, incorporate it into your design process: brainstorm data points, select slides, customize, rehearse. This streamlined approach has helped countless tech pros deliver polished pitches.
Elevate your device presentations today - download this template and watch your ideas connect seamlessly.
FAQ
How editable are the charts in this Devices PowerPoint Template?
Every chart is fully editable, allowing changes to data, colors, sizes, and layouts directly in PowerPoint.
Is this template compatible with Google Slides?
No, it's optimized for PowerPoint (.pptx), but you can import it into Google Slides with some formatting adjustments.
What types of devices can I represent with the icons?
The template includes icons for smartphones, laptops, tablets, wearables, and more, customizable for any gadget.
Can I use this for non-tech presentations?
While device-themed, the charts are versatile for any data visualization needing a modern, tech-inspired look.
How do I add my own data to the charts?
Simply double-click the chart, enter your values in the linked Excel sheet, and watch the visuals update automatically.
Are there any usage restrictions?
No, once purchased, you can use it for unlimited personal or professional presentations.