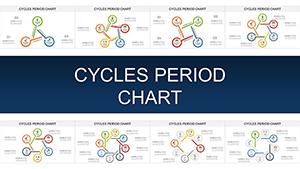
Craft Compelling Narratives: Visual Portfolio PowerPoint Charts Template


Type: PowerPoint Charts template
Category: Tables
Sources Available: .pptx
Product ID: PC00886
Template incl.: 40 editable slides
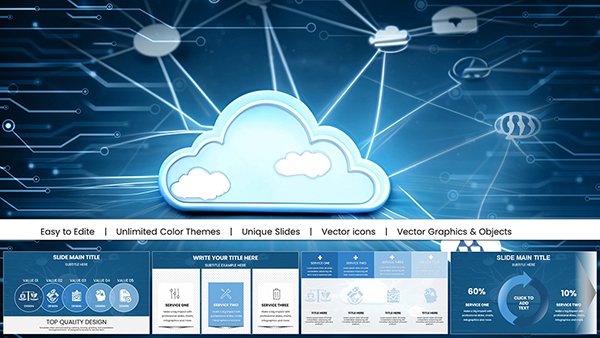
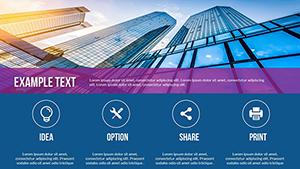
Step into the spotlight with a portfolio that doesn't just list achievements - it showcases them in a symphony of charts and visuals that demand attention. This visual portfolio PowerPoint template is your backstage pass to professional polish, featuring 40 editable slides brimming with bar graphs, line trends, pie breakdowns, and scatter plots, all accented by curated icons and image placeholders. Tailored for creatives, project leads, business pros, and academics weary of text-heavy resumes, it transforms mundane metrics into mesmerizing stories that linger long after the slide fades.
Why settle for static PDFs when you can deliver dynamic decks that mirror your expertise? Rooted in portfolio best practices from AIGA design standards, this template tackles the universal creator's conundrum: how to quantify passion. From freelance photographers mapping client growth to researchers plotting publication impacts, it empowers you to highlight not just what you've done, but the value you've created - making every pitch a portfolio powerhouse.
Versatile Foundations: Exploring Slide Types and Customizations
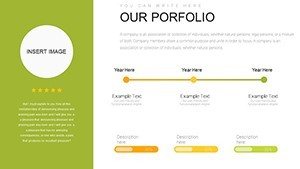
Dive deep into a library where every slide serves a purpose. The project portfolio variants track timelines with Gantt-inspired lines, while creative ones burst with gallery grids for mood boards. Business-focused? Financial pies dissect ROI, and academic scatters correlate citations with collaborations.
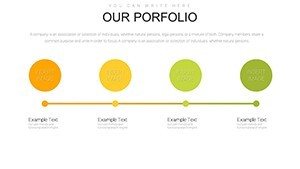
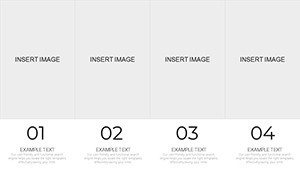
- Project Showcase Slides (1-10): Timeline bars for milestones, editable for agile sprints - think a web dev firm visualizing launch phases, aligning with Scrum methodologies.
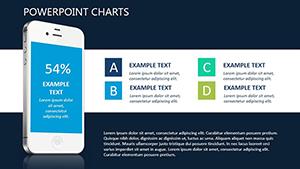
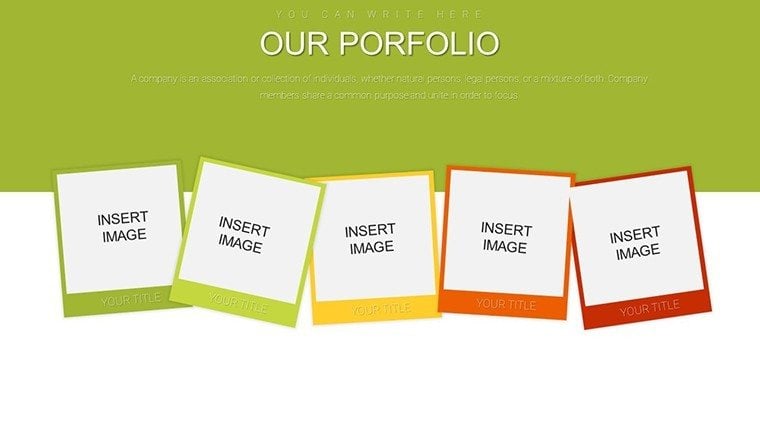
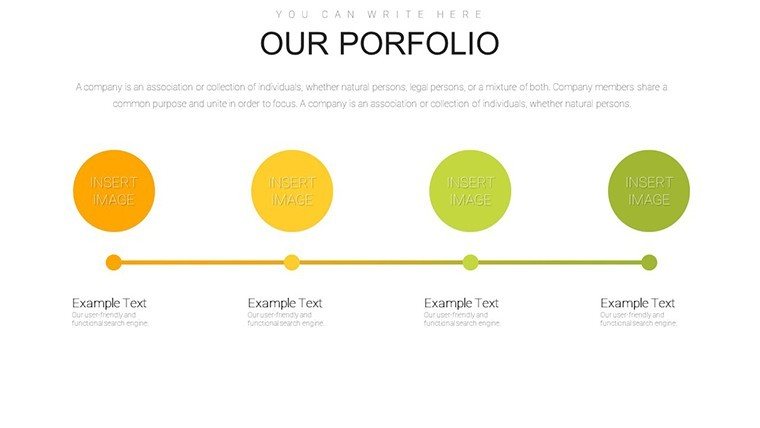
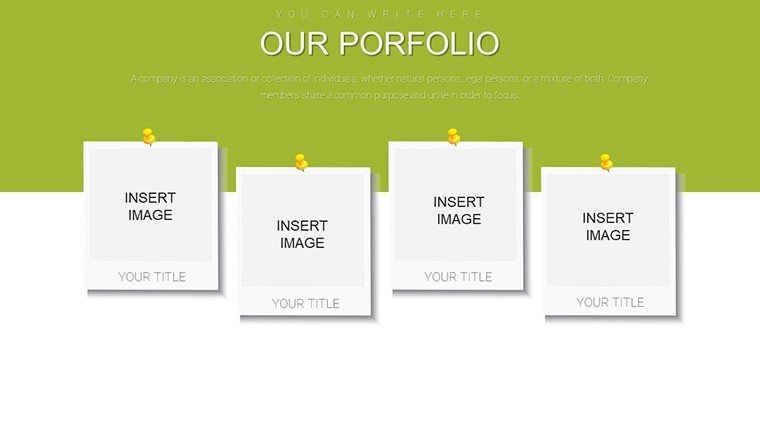
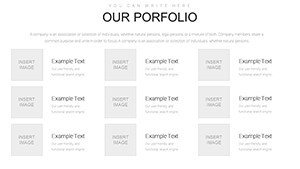
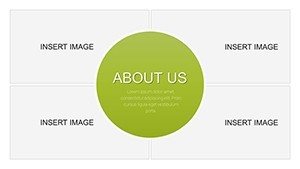
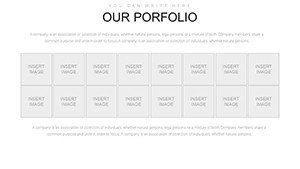
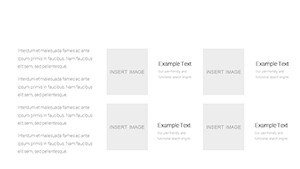
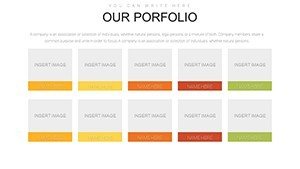
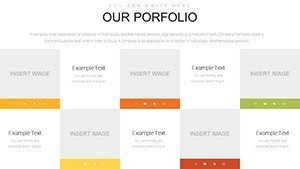
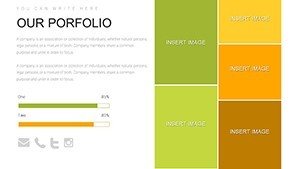
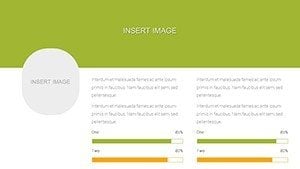
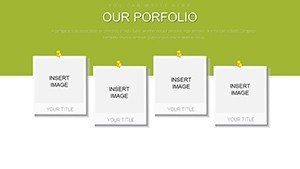
- Creative Highlight Reels (11-20): Image-heavy pies for media mixes, with drag-in spots for high-res uploads. A graphic designer in Berlin used these to segment style evolutions, landing a TEDx gig.
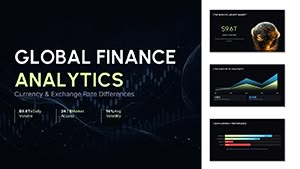
- Business Achievement Maps (21-30): Stacked bars for revenue streams, color-coded for quick scans during investor meets.
- Academic Impact Visuals (31-40): Scatter plots linking grants to outputs, ideal for tenure dossiers per APA guidelines.
All elements are PowerPoint-native, with Google Slides harmony for feedback loops. High-fidelity icons (100+ options) and sans-serif fonts ensure legibility, while aspect-ratio locks prevent warp woes.
Real Impact Stories: Portfolios That Persuade
A Vancouver architect leveraged the line chart slide to graph sustainable builds' energy savings, weaving in client testimonials via text overlays. "It shifted focus from blueprints to breakthroughs," notes the firm, echoing LEED certification emphases. In academia, a PhD candidate at Oxford plotted network analyses with scatters, clarifying interdisciplinary ties for grant panels.
For solopreneurs, it's pitch perfection: Use a combo chart to fuse qualitative wins (awards) with quant (billables), outshining LinkedIn summaries. In team settings, collaborative edits via OneDrive turn solo efforts into shared successes.
- Curate Content: Select 5-7 key projects, feeding metrics into pre-formatted cells for auto-charting.
- Infuse Personality: Layer personal photos with subtle fades, balancing pro with approachable.
- Refine Flow: Sequence slides logically - intro overview, deep dives, closing call-to-action.
- Test & Tweak: Run through stakeholder previews, adjusting scales for universal appeal.
This ritual rivals pro agencies, minus the invoice.
Beyond Basics: Design Mastery and Time Hacks
Elevate with consistent palettes - Earth tones for eco-projects, neons for tech - guided by color theory from Adobe experts. Avoid overload: Cap data points at 7 per chart, per Gestalt principles, for cognitive ease.
Versus DIY: Native shapes demand endless tweaks; here, smart art evolves into sophisticated sans hassle. Animate sparingly - fades for transitions, zooms for emphases - to guide eyes without gimmicks.
Solving Showcase Struggles
Text tombs? These visuals cut read times by 50%, per eye-tracking studies. Inclusivity baked in: Alt texts like "Bar chart: Project revenue growth 150% YoY" for accessibility wins.
For hybrid events, embed QR codes linking to full portfolios, extending engagement. In creative agencies, it streamlines mood board merges, fostering ideation flows.
Your Portfolio, Amplified: Final Flourishes
Cap with a reflection slide: A radial chart of growth areas, inviting dialogue. It's not mere display - it's declaration of potential.
Unlock your narrative's full force with this visual portfolio PowerPoint charts template. Download and dazzle; your work deserves the stage.
Frequently Asked Questions
What chart types are included in this visual portfolio template?
Bar, line, pie, scatter, and more - 40 slides cover diverse needs from timelines to financials.
Can I add my own images and icons easily?
Yes, placeholders and a 100+ icon library make swaps intuitive and instant.
Is it compatible with both PowerPoint and Google Slides?
Fully - seamless across platforms for solo or team use.
How does it help with project management portfolios?
Gantt-style timelines and risk pies highlight skills, aligning with PMI standards.
Are animations included for presentations?
Subtle, customizable ones to enhance flow without distraction.
What's the best way to ensure visual consistency?
Use the built-in theme tools for unified colors, fonts, and layouts throughout.