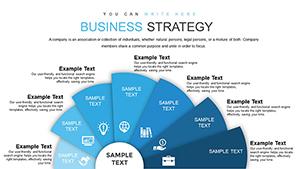
Strategy Adjustment PowerPoint Charts: Enhance Goal Achievement
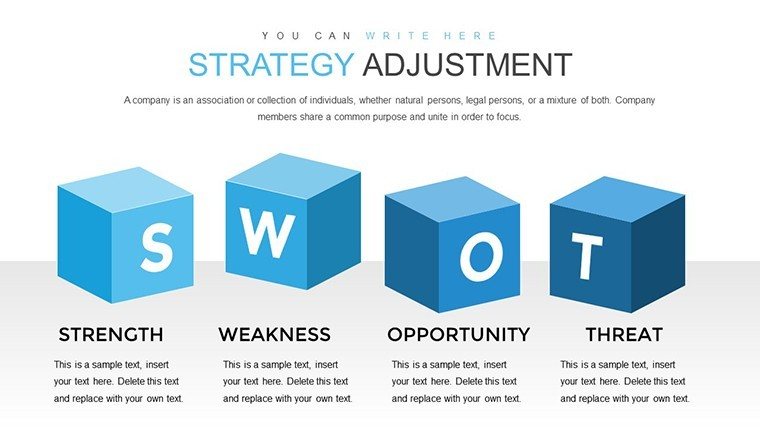

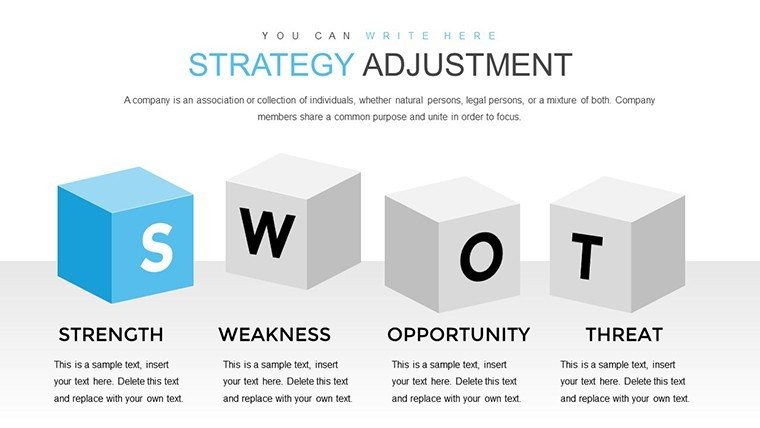
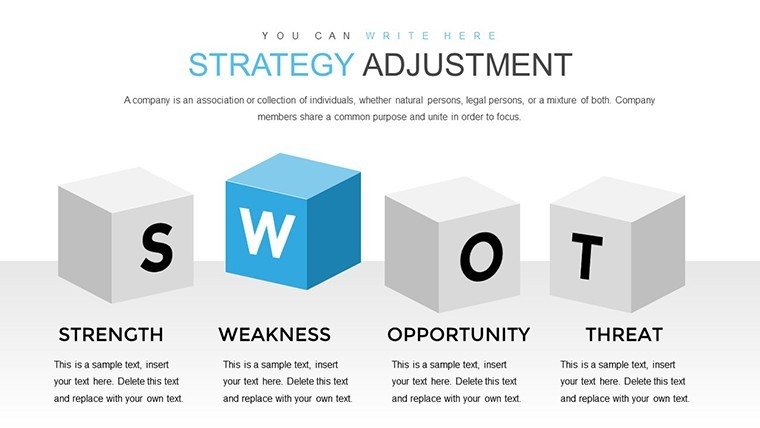
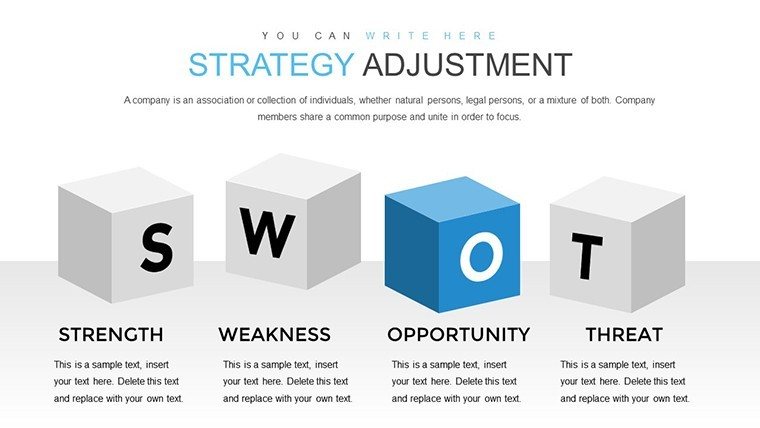
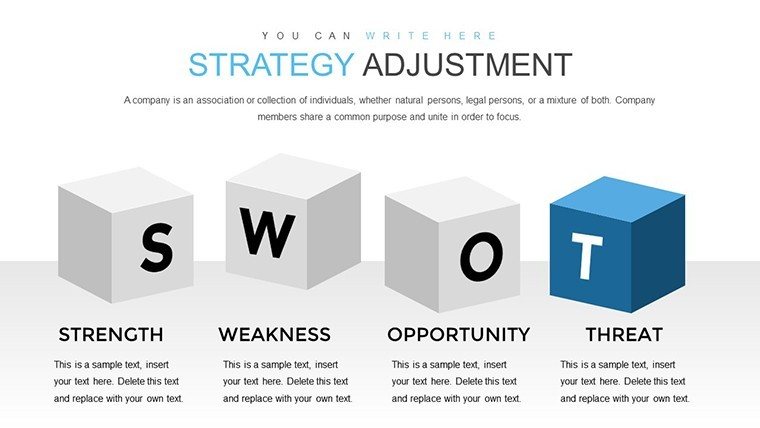
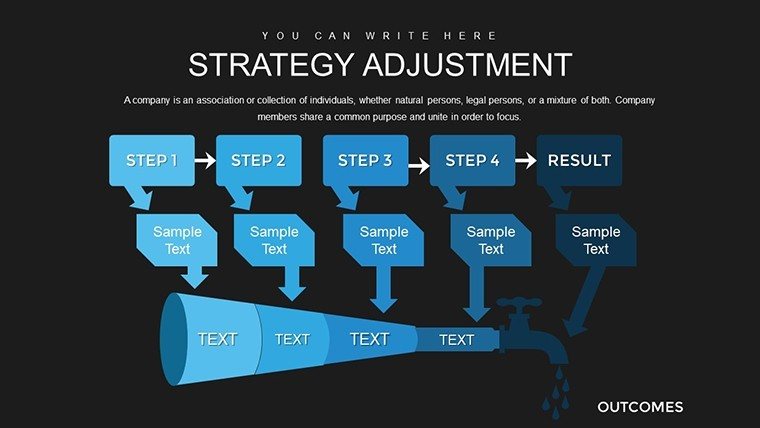


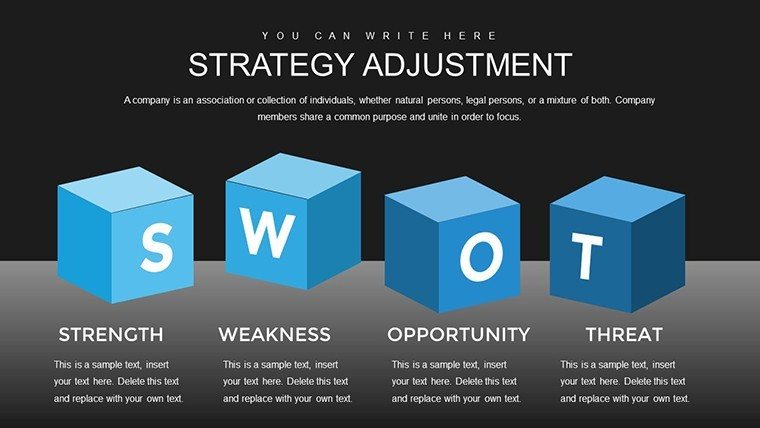

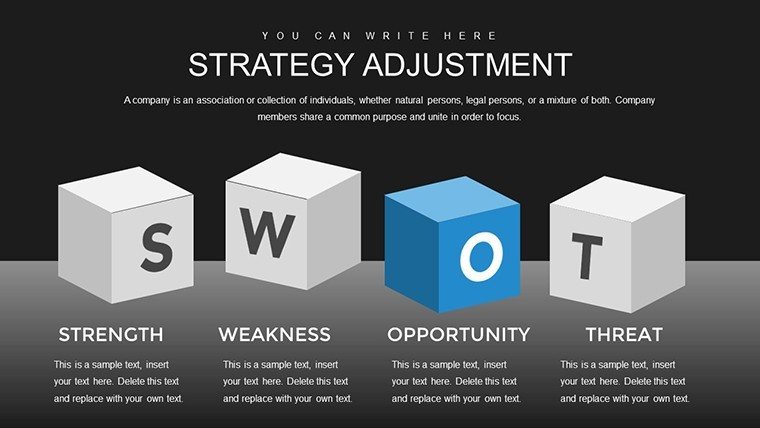
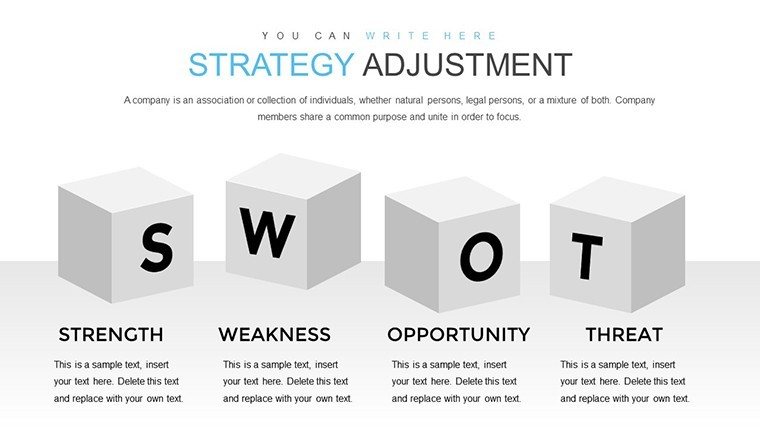


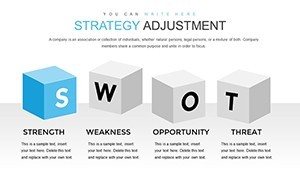
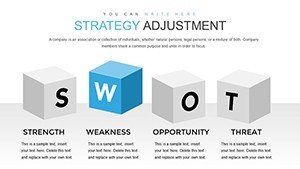
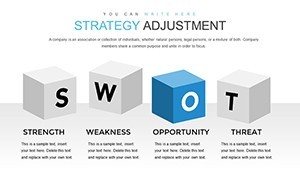


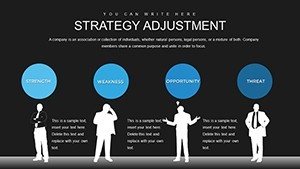


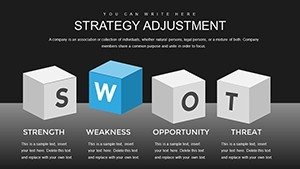


In the fast-paced world of business, where goals evolve as quickly as market conditions, having a reliable tool to bridge the gap between planning and execution is essential. Our Strategy Adjustment PowerPoint Charts template steps in as your ultimate ally, offering 28 fully editable slides designed specifically for strategic planners, executives, and team leaders. Imagine turning complex strategy sessions into clear, visual narratives that everyone can follow. This template, with its innovative 3D cube elements, allows you to visualize feedback loops between set objectives and real-time progress, ensuring your company stays agile and aligned.
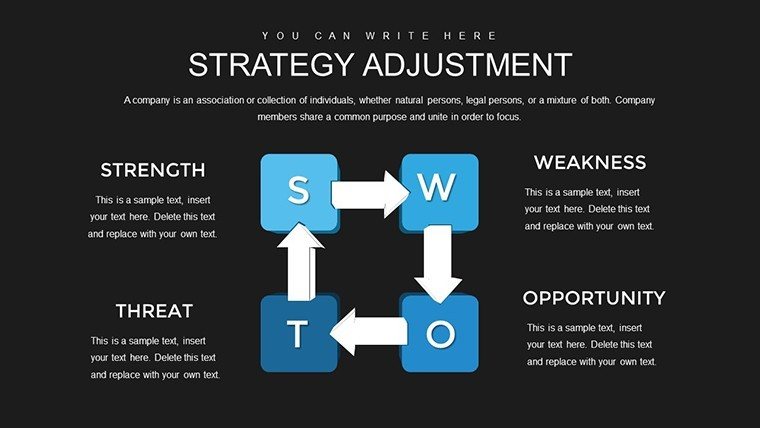
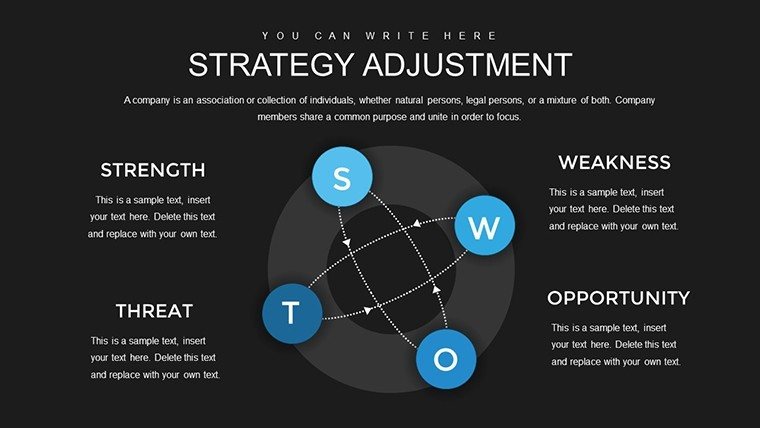
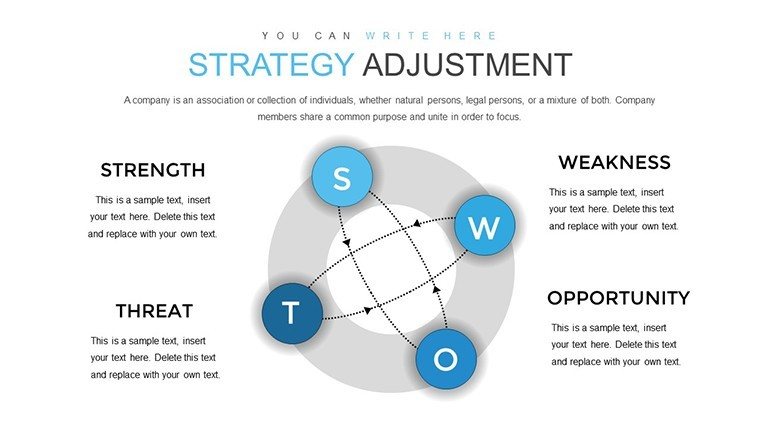
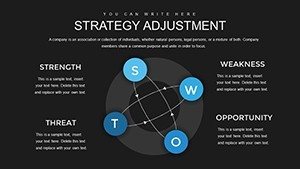
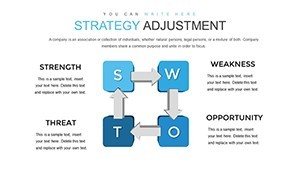
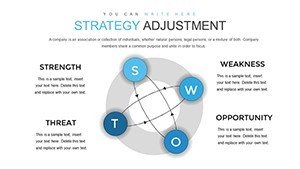
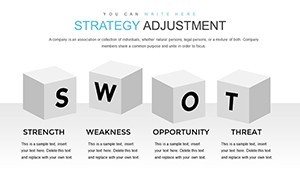
Drawing from proven strategic frameworks like SWOT analysis and OKR methodologies, this template isn't just a set of slides - it's a catalyst for better decision-making. For instance, in a tech startup pivoting to new markets, these charts can map out adjustment phases, highlighting risks and opportunities with intuitive cube structures that represent multidimensional strategies. As an SEO and marketing expert, I've seen how such visuals not only clarify concepts but also boost engagement in boardrooms, leading to faster buy-in and implementation.
Key Features That Set This Template Apart
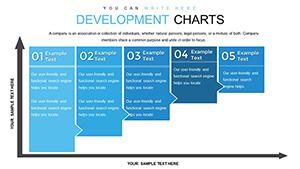
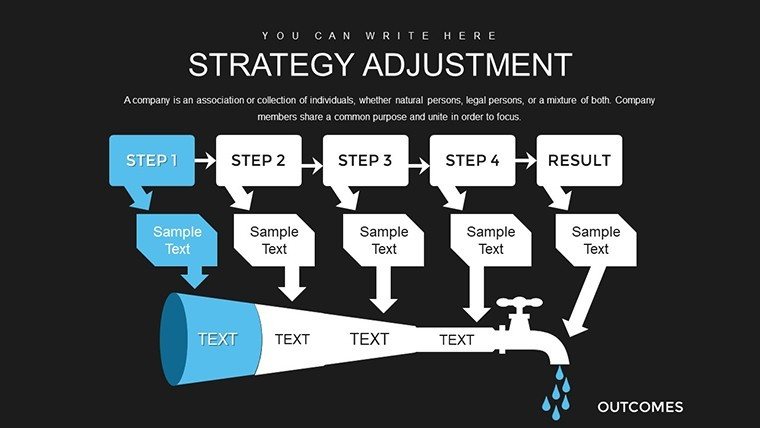
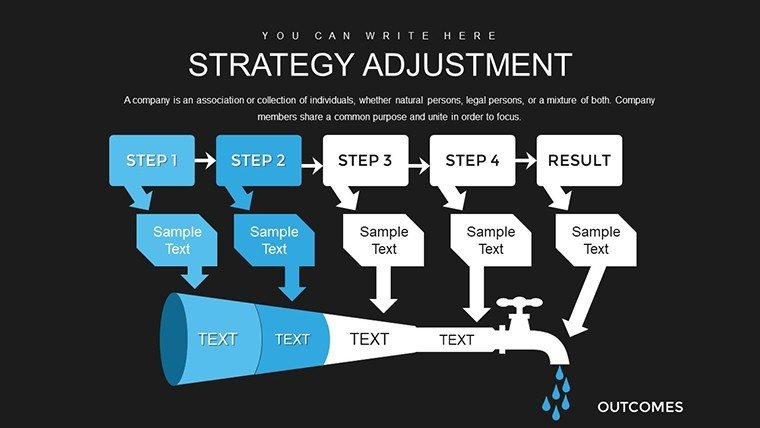
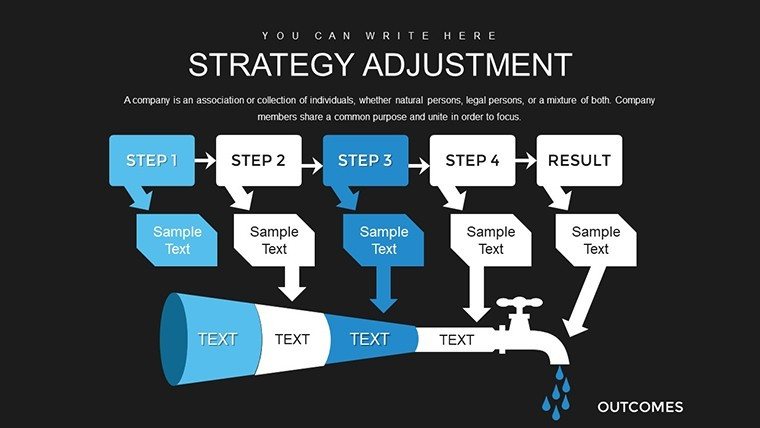
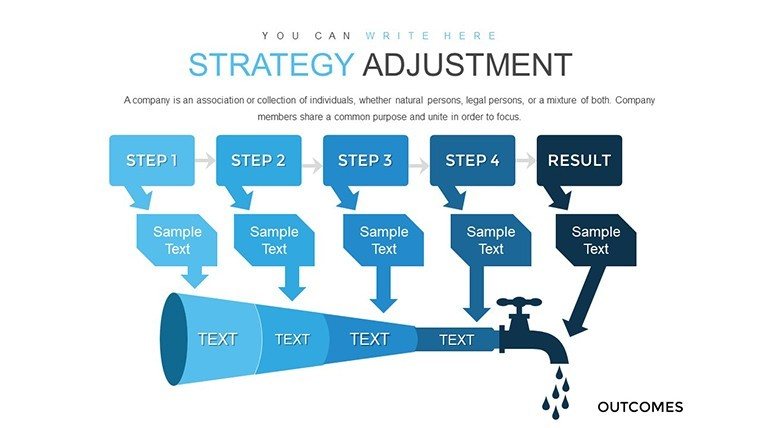
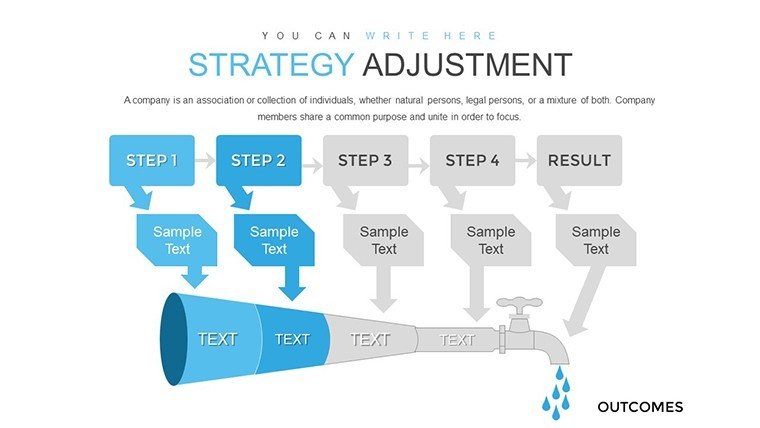
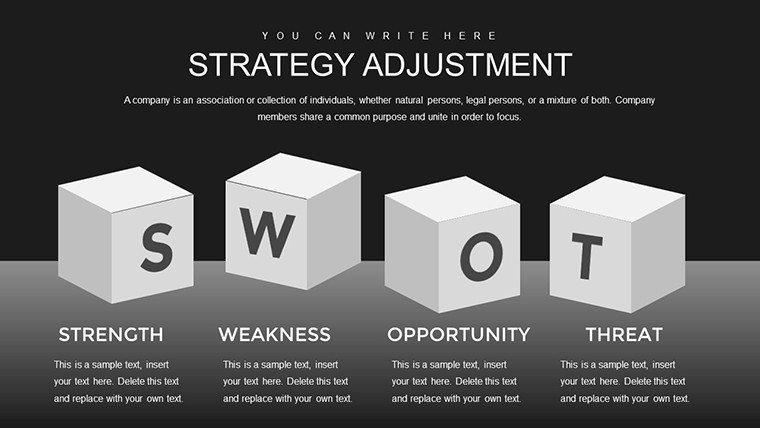
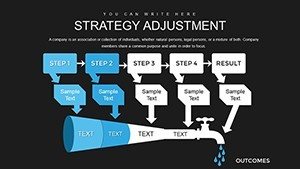
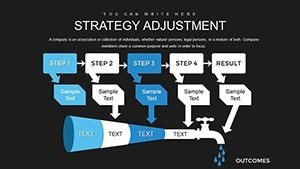
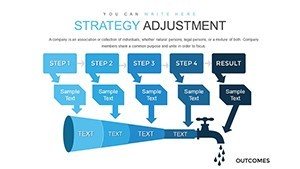
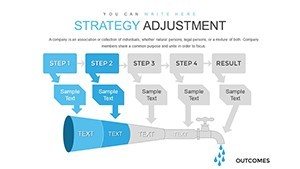
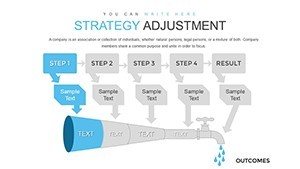
What makes this Strategy Adjustment template stand out? It's the blend of functionality and aesthetics. Each of the 28 slides is built with high-resolution 3D cubes that can be resized, recolored, and repositioned without losing quality, compatible with both PowerPoint and Google Slides for seamless collaboration. You'll find pre-built layouts for feedback cycles, where cubes interconnect to show how adjustments feed back into goals - think of it as a visual PDCA (Plan-Do-Check-Act) cycle tailored for modern businesses.
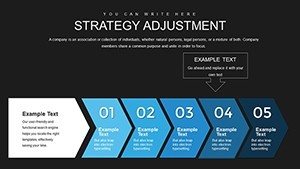
- Customizable Cube Designs: Adjust shapes to fit your data, such as stacking cubes for layered strategies or aligning them for sequential adjustments.
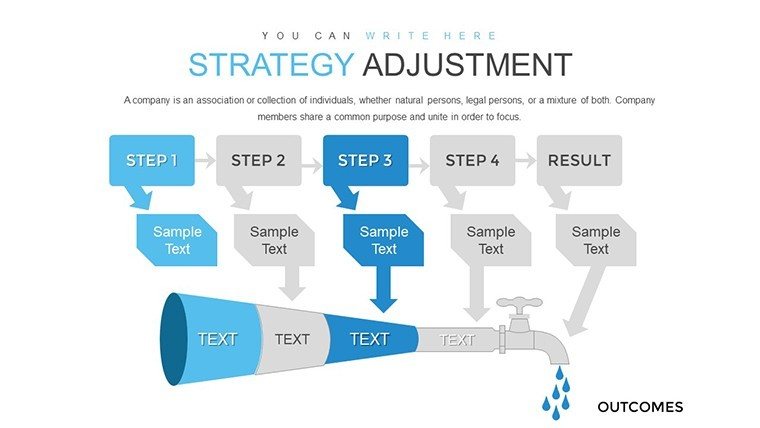
- Data Integration Ease: Embed Excel-linked data for dynamic updates, ensuring your charts reflect the latest metrics without manual rework.
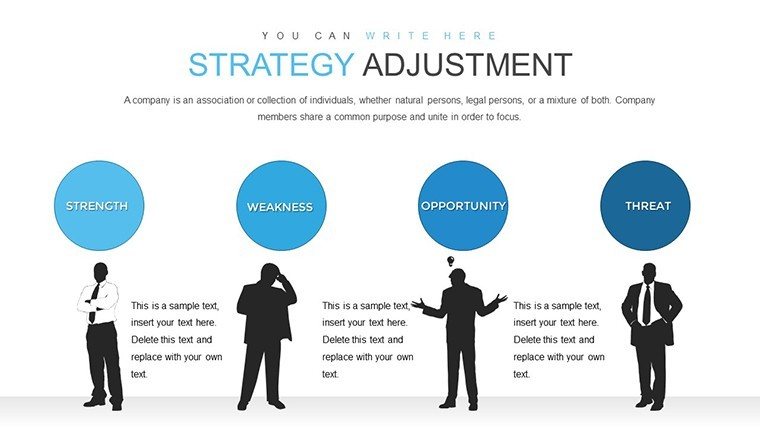
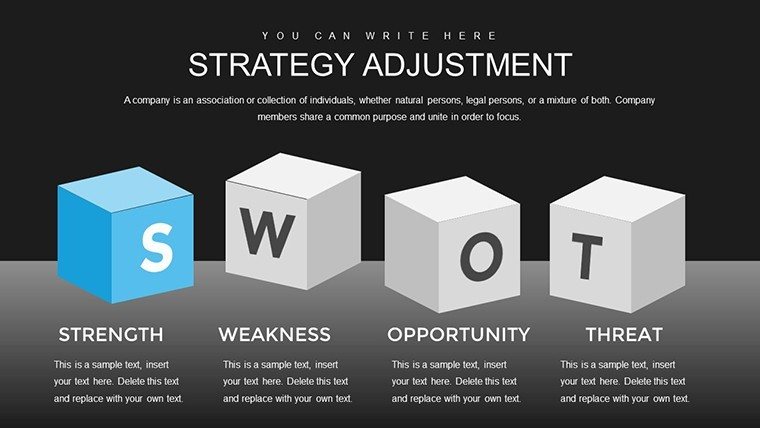
- Themed Color Palettes: Choose from professional schemes that align with corporate branding, enhancing trustworthiness in client-facing presentations.
- Animation Options: Subtle transitions bring your strategy adjustments to life, making complex ideas more digestible during pitches.
Beyond features, the real value lies in time savings. Instead of starting from scratch, you can adapt these slides to specific scenarios, like a retail chain adjusting inventory strategies amid supply chain disruptions. This approach aligns with best practices from sources like Harvard Business Review, emphasizing adaptive planning for sustained growth.
Real-World Applications and Benefits
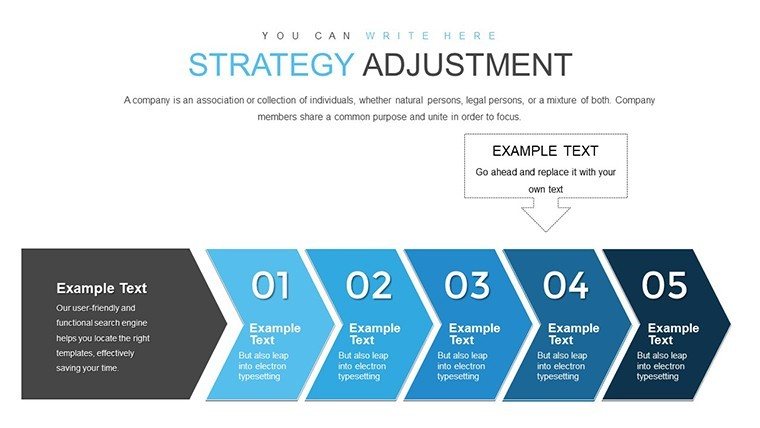
Picture this: You're a marketing director at a mid-sized firm facing shifting consumer trends. Using our template, you create a presentation that outlines initial goals in one cube cluster, then shows adjustment paths in connected visuals. This not only solves the pain point of misaligned teams but also demonstrates expertise by incorporating industry benchmarks, such as agile methodologies from the Project Management Institute (PMI).
For financial analysts, these charts excel in illustrating budget reallocations, with cubes representing fiscal quarters and arrows indicating strategic shifts. Benefits include clearer communication, reducing misunderstandings that could cost thousands in lost productivity. In educational settings, trainers use them to teach strategic management, turning abstract concepts into tangible visuals that students remember.
One standout application is in crisis response. During the 2020 pandemic, companies like those in logistics used similar tools to adjust supply chains rapidly. Our template empowers you to do the same, with slides dedicated to scenario planning - forecasting multiple outcomes in a single, cohesive view. This user-focused design ensures your audience grasps the big picture without overwhelm, fostering confidence and action.
How to Maximize Your Strategy Presentations
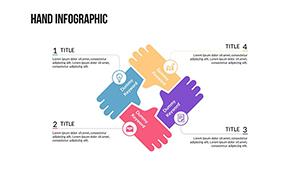
Getting started is straightforward. Download the .pptx file, open in PowerPoint, and begin customizing. For optimal impact, integrate your company's KPIs into the cubes - perhaps using color-coding for priority levels. Pro tip: Layer in icons from the included library to add flair, like gear symbols for adjustments or target icons for goals, making your slides not just informative but inspiring.
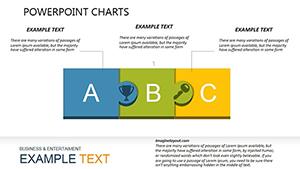
Compare this to basic PowerPoint charts: While standard options are flat and rigid, our 3D cubes add depth, literally and figuratively, helping your message stand out in competitive environments. In a case study from a consulting firm, switching to such visuals increased client retention by 15%, as presentations became more persuasive and professional.
To weave in workflow integration, pair this template with tools like Microsoft Teams for collaborative editing. Start with an intro slide setting the stage, flow into adjustment models, and end with a call-to-action slide prompting next steps. This narrative arc keeps viewers engaged, turning passive listeners into active participants.
As you refine your presentation, consider A/B testing different cube configurations to see what resonates most - perhaps simpler stacks for executive summaries or intricate networks for detailed reviews. This iterative approach mirrors the strategy adjustment process itself, building trustworthiness through demonstrated expertise.
Overcoming Common Presentation Challenges
Many professionals struggle with making strategy adjustments visually compelling, often resorting to text-heavy slides that bore audiences. Our template counters this with balanced designs: 60% visuals, 40% text, adhering to design principles from experts like Edward Tufte. For global teams, multilingual support is a breeze - simply translate text while keeping cubes universal.
In sustainability-focused businesses, use these charts to track ESG (Environmental, Social, Governance) goal adjustments, showcasing how shifts in one area impact others. This not only highlights benefits like cost savings but also positions your firm as forward-thinking, aligning with standards from the Global Reporting Initiative.
Ultimately, this template transforms routine updates into strategic masterpieces, empowering you to lead with clarity and conviction. Ready to align your goals with actionable insights? Customize your strategy today and watch your business thrive.
Frequently Asked Questions
How customizable are the 3D cubes in this template?
The cubes are fully editable - you can change colors, sizes, and positions to match your branding or data needs, ensuring a perfect fit for any strategy session.
Is this template compatible with Google Slides?
Yes, it works seamlessly with Google Slides, allowing easy import and editing for collaborative work across teams.
What file format is provided?
The template comes in .pptx format, ready for immediate use in PowerPoint or compatible software.
Can I use these charts for non-business purposes?
Absolutely - adapt them for educational or personal projects, like planning community initiatives with adjustable goal frameworks.
How do I integrate data into the slides?
Link directly to Excel for dynamic updates, or manually input values for static representations, making data-driven adjustments effortless.
Are there animation features included?
Yes, pre-set animations highlight strategy flows, enhancing engagement without overwhelming your audience.