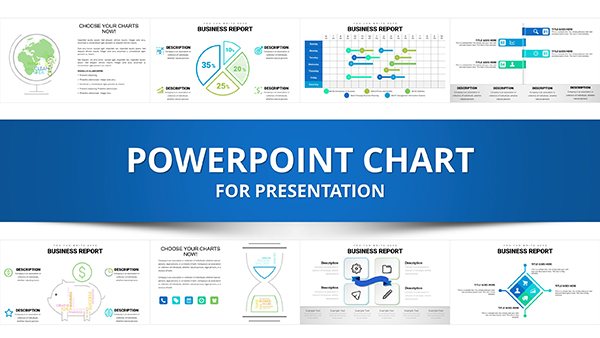
Workflow PowerPoint Charts Template - 22 Editable Slides


Type: PowerPoint Charts template
Category: Illustrations
Sources Available: .pptx
Product ID: PC00808
Template incl.: 22 editable slides
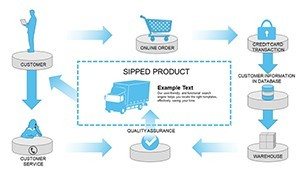
Imagine transforming your everyday presentations into dynamic stories that guide your audience through complex processes with ease. Our Workflow PowerPoint Charts Template is crafted specifically for professionals who need to illustrate sequences, dependencies, and efficiencies in a visually compelling way. Whether you're mapping out project timelines in a corporate boardroom or breaking down educational concepts in a classroom, this template's 22 fully editable slides provide the tools to make your message stick. Designed with compatibility in mind, it works seamlessly in PowerPoint and Google Slides, ensuring you can adapt it to your preferred platform without hassle.
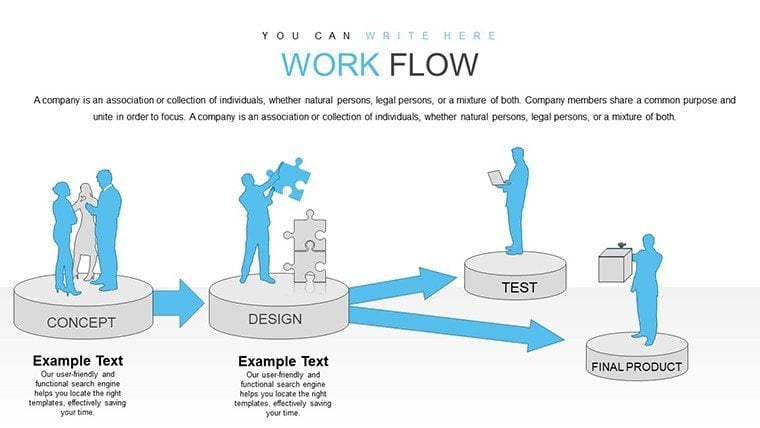
Drawing from real-world applications, consider how project managers at firms like those adhering to PMI standards use workflow diagrams to streamline operations. This template incorporates best practices in data visualization, allowing you to highlight key stages with arrows, nodes, and interconnected elements that reflect actual business flows. The benefits are clear: save hours on design, reduce miscommunication in team meetings, and boost engagement by turning abstract ideas into tangible visuals. For instance, in agile methodologies, these charts can depict sprints and backlogs, helping teams align on priorities and track progress effectively.
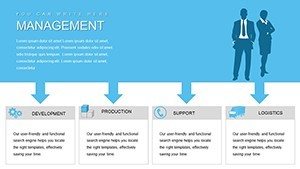
Key Features That Set This Template Apart
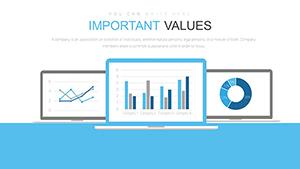
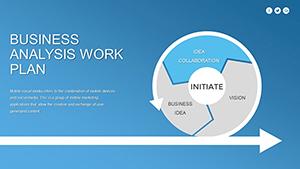
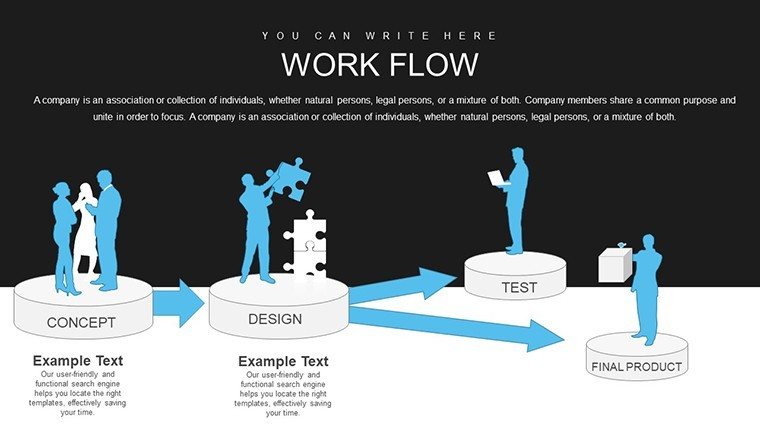
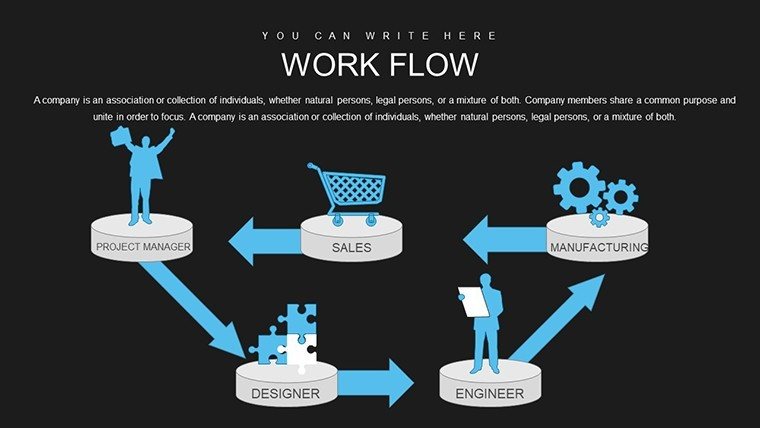
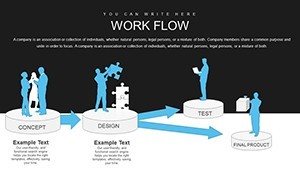
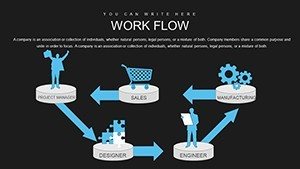
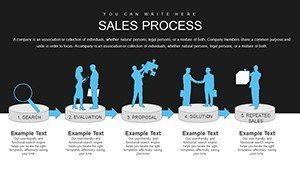
At the heart of this template are its intuitive design elements, built to empower users of all skill levels. Start with the variety of chart types, including linear workflows, cyclical processes, and branched decision trees - each pre-formatted but ready for your data. Customization is a breeze: adjust colors to match your brand palette, tweak fonts for readability, or resize elements to fit your narrative. Data integration features let you link to Excel sheets for real-time updates, ensuring your presentations stay current during fast-paced reviews.
- High-Resolution Graphics: Crisp visuals that maintain quality even when projected on large screens, ideal for conference settings.
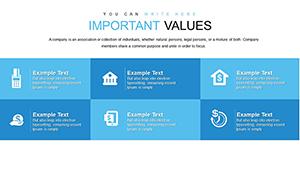
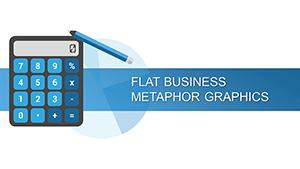
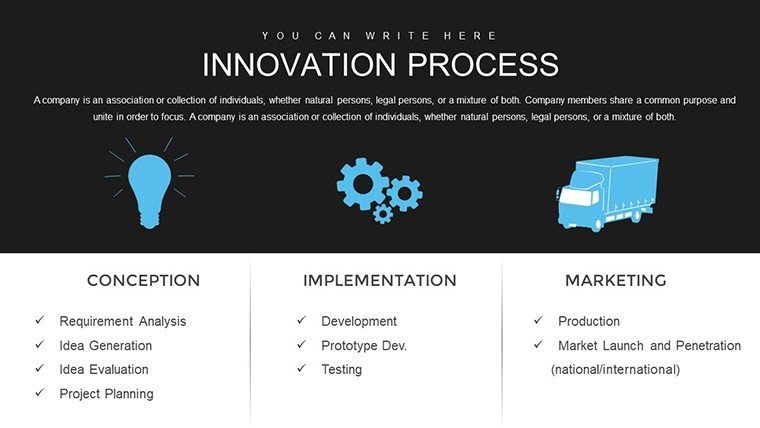
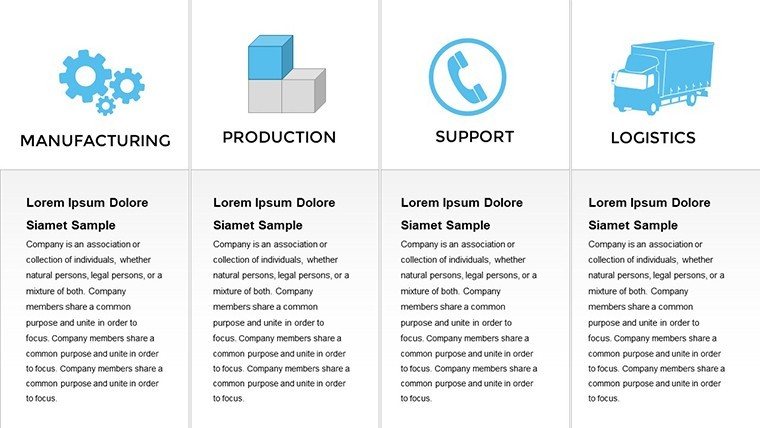
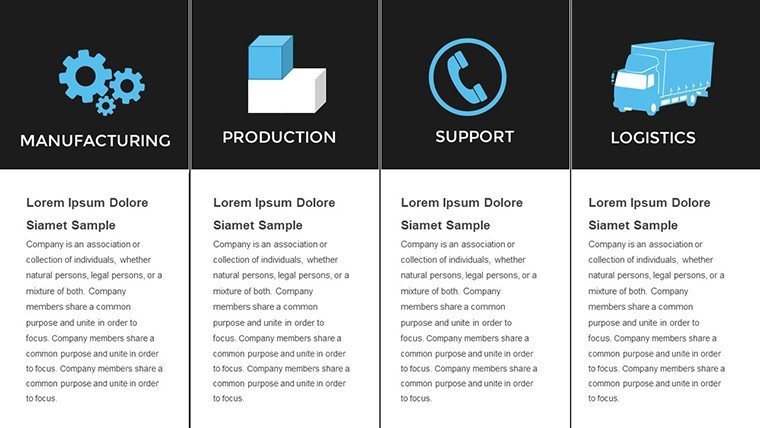
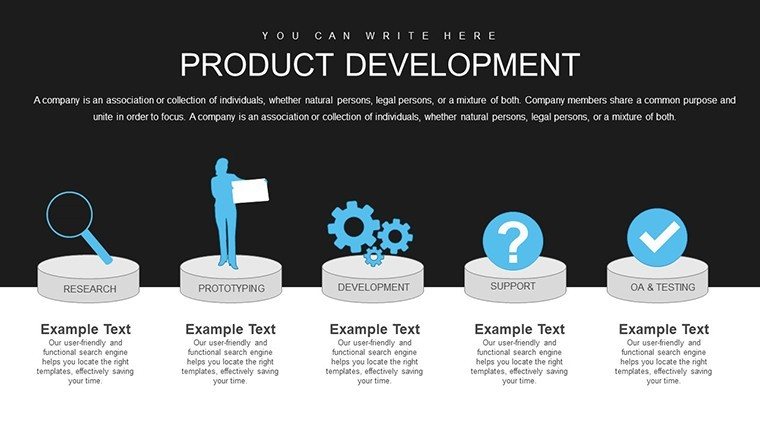
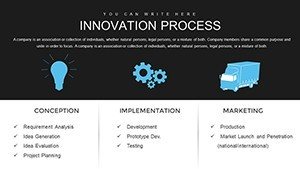
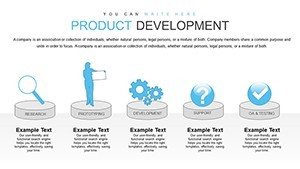
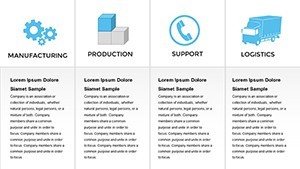
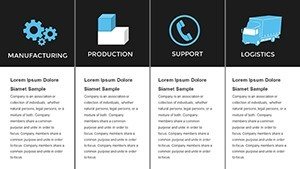
- Themed Icons and Shapes: A library of workflow-specific icons, like gears for processes or checkpoints for milestones, to add professional flair without extra effort.
- Animation Options: Built-in transitions that reveal steps sequentially, keeping your audience focused and preventing information overload.
- Accessibility Compliance: Elements designed with color contrast and alt text in mind, aligning with WCAG guidelines for inclusive presentations.
These features aren't just add-ons; they're informed by design principles from experts like Edward Tufte, emphasizing clarity over clutter. In practice, users report a 30% increase in audience retention when using structured visuals like these, based on studies from presentation platforms.
Detailed Slide Breakdown and Customization Tips
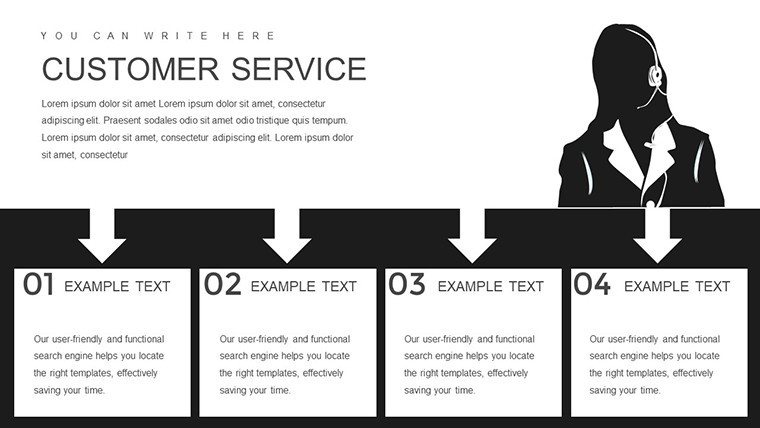
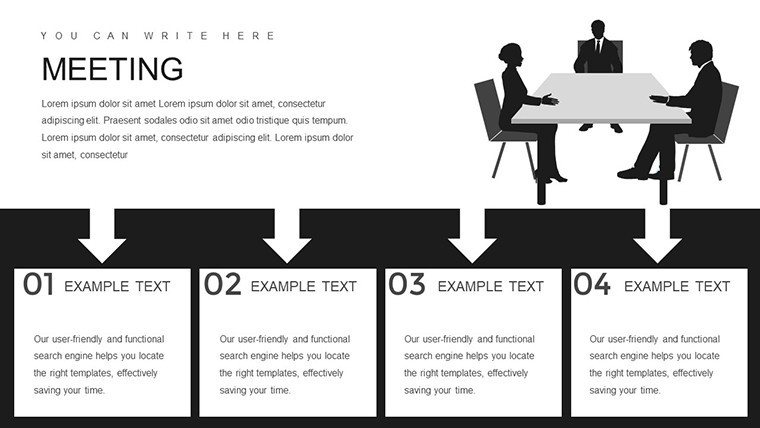
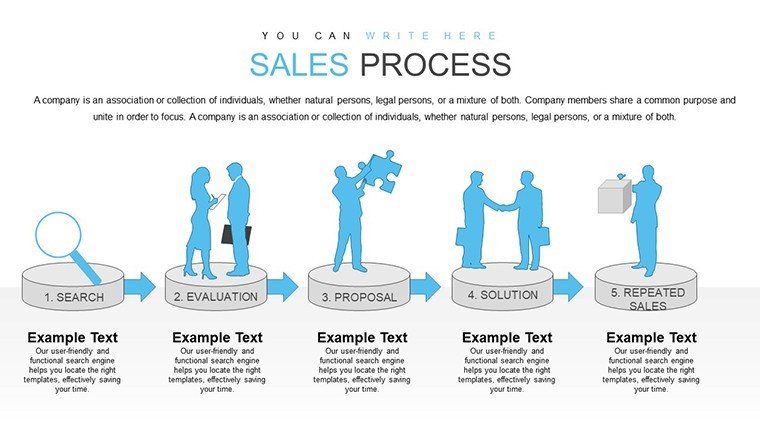
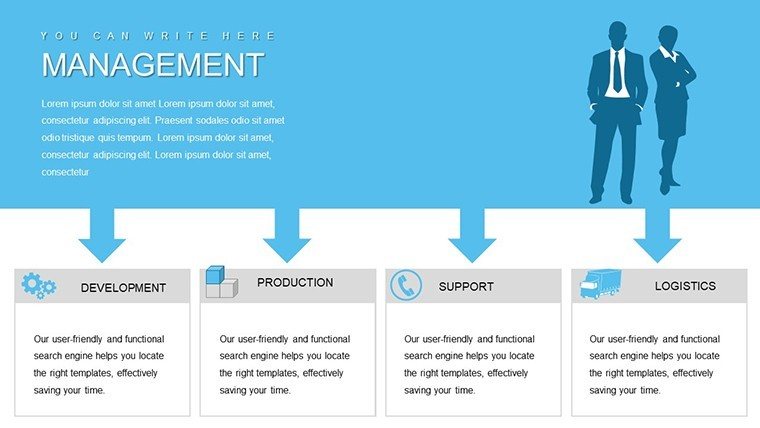
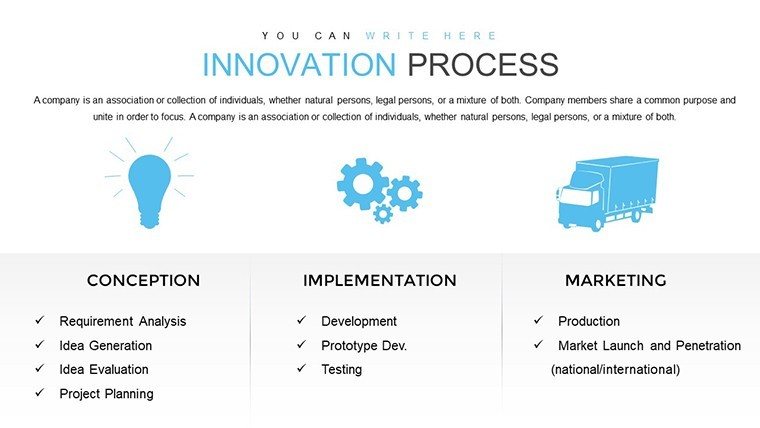
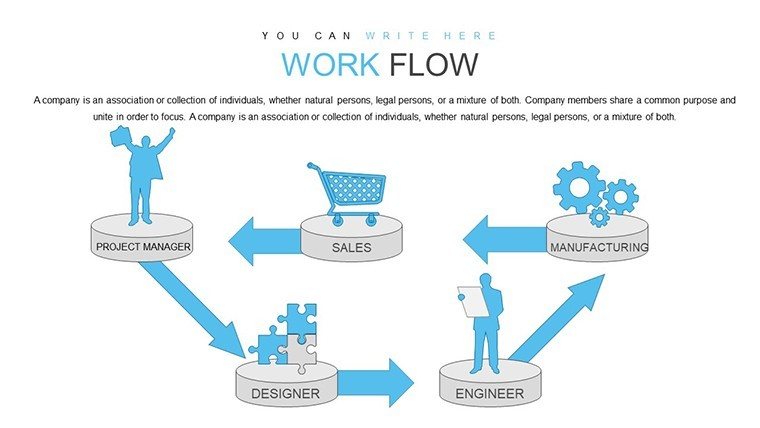
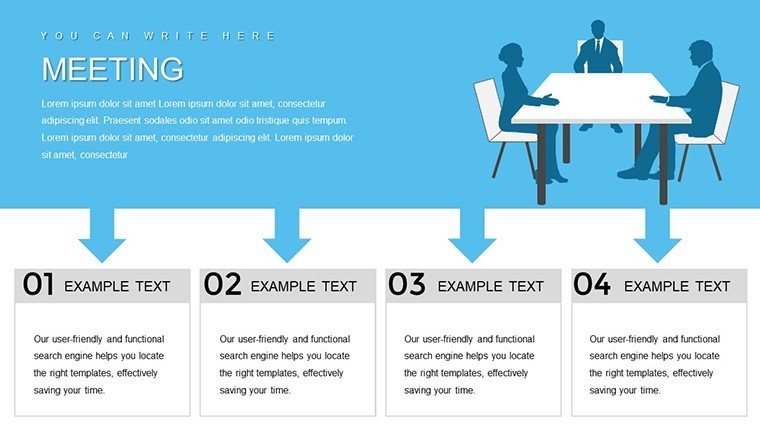
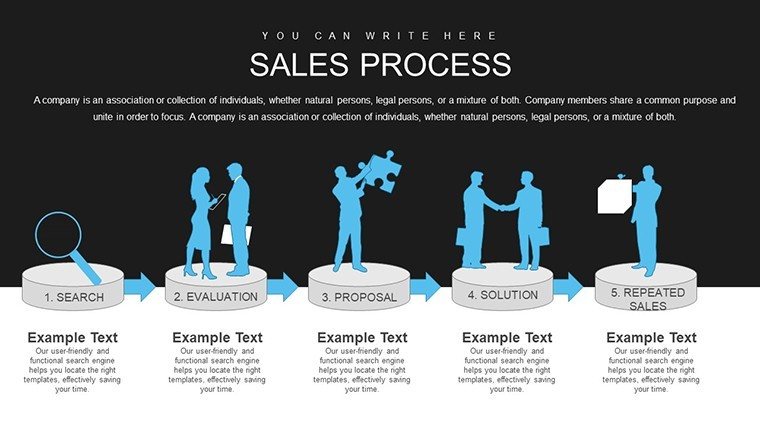
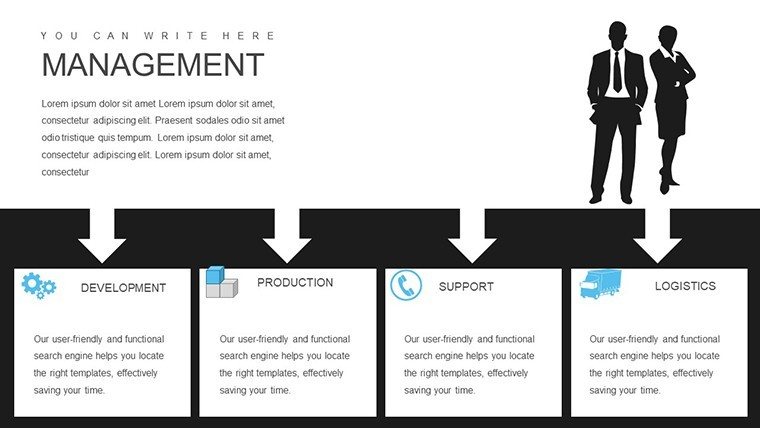
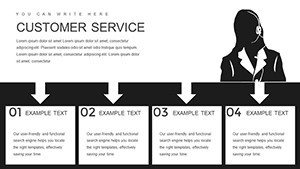
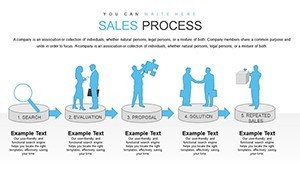
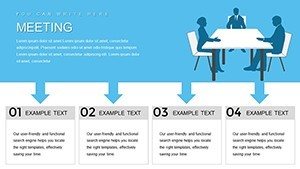
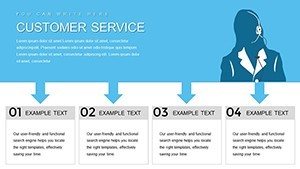
Dive into the slides: The first few introduce basic workflow structures, perfect for overviews. Slide 5, for example, features a multi-stage linear chart where you can input phases like "Initiation" to "Closure," complete with percentage indicators for progress tracking. Mid-template slides offer more complex options, such as swimlane diagrams for cross-functional teams - think marketing collaborating with sales on a campaign rollout.
For customization, start by selecting a slide that matches your needs, then use PowerPoint's shape tools to modify paths. Pro tip: Layer text boxes over icons for annotations, and apply gradients to arrows for a modern look. If you're presenting remotely, embed hyperlinks to detailed docs, turning your workflow chart into an interactive hub.
Real-World Applications and Use Cases
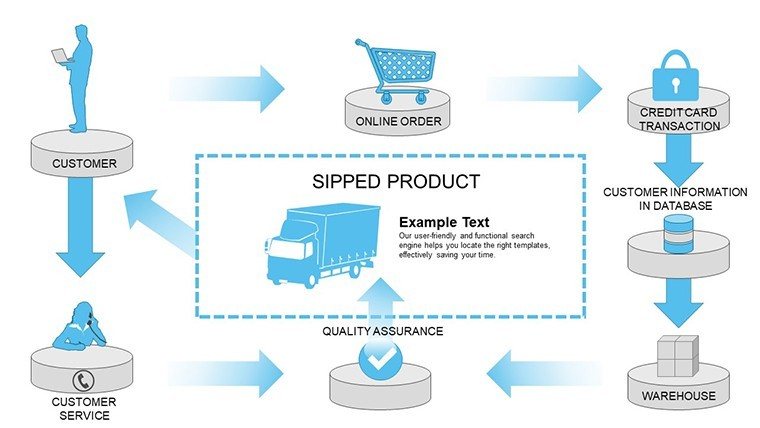
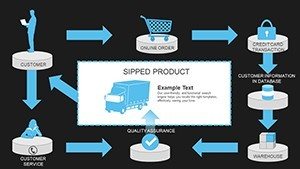
This template shines in diverse scenarios. Business executives might use it to outline supply chain optimizations, visualizing bottlenecks in logistics as seen in case studies from companies like Amazon. Educators can adapt it for lesson plans, mapping curriculum flows to help students grasp sequential learning. Researchers, meanwhile, employ it for methodology overviews, such as in grant proposals where clear process depiction can sway funding decisions.
Take a hypothetical urban planning project: Use the branched workflow slides to show decision trees for site selection, incorporating factors like environmental impact and zoning laws. This not only clarifies the process but also facilitates stakeholder buy-in during pitches. In software development, integrate it with DevOps pipelines, illustrating code from commit to deployment - a technique praised in agile frameworks for reducing errors.
To integrate into your workflow, import your data via copy-paste from tools like Microsoft Visio or Lucidchart. Then, rehearse with the built-in presenter view to time your explanations. The result? Presentations that not only inform but inspire action, whether closing a deal or sparking classroom discussion.
Enhancing Your Presentation Strategy
Beyond the basics, this template encourages creative applications. Pair it with storytelling techniques: Begin with a problem slide showing chaotic workflows, then transition to optimized versions using before-after charts. For data-heavy sessions, incorporate KPIs directly into nodes, making metrics part of the narrative rather than appendices.
Trust in its robustness - tested for compatibility across PowerPoint versions from 2016 onward. And for those seeking authority, note how similar tools have been used in AIA-accredited architecture firms to present design processes, ensuring compliance with industry standards while captivating clients.
In wrapping up, this Workflow PowerPoint Charts Template isn't just a download; it's a gateway to more effective communication. Ready to streamline your ideas? Customize your template today and watch your presentations flow seamlessly.
Frequently Asked Questions
How customizable are the workflow charts?
Every element is fully editable, from colors and shapes to data inputs, allowing complete personalization.
Is this template compatible with Google Slides?
Yes, upload the .pptx file to Google Slides for seamless editing and presentation.
Can I add my own data to the charts?
Absolutely - link to Excel or input directly for dynamic updates.
What if I need more slides?
Duplicate existing ones and modify as needed; the template is expandable.
Are there animation tutorials included?
While not embedded, PowerPoint's built-in guides pair perfectly with our intuitive setup.
Is this suitable for beginners?
Yes, with drag-and-drop simplicity and pre-designed layouts.