3D Funnel PowerPoint Charts Template: Visualize Processes
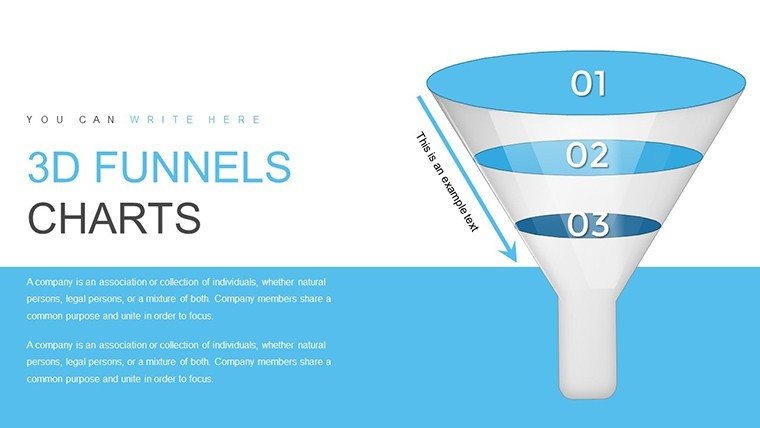


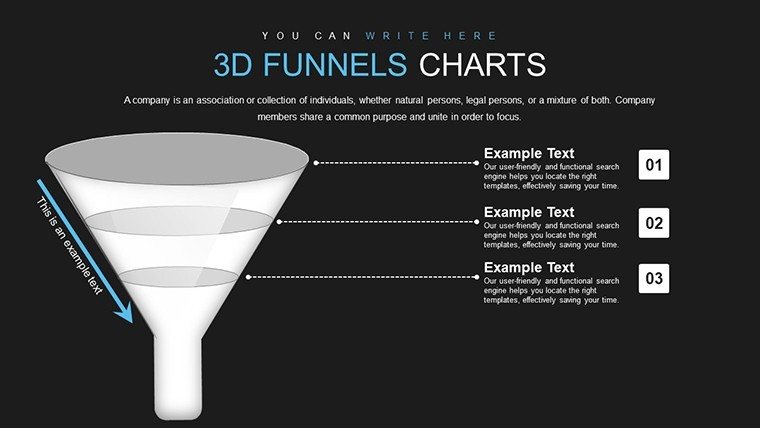

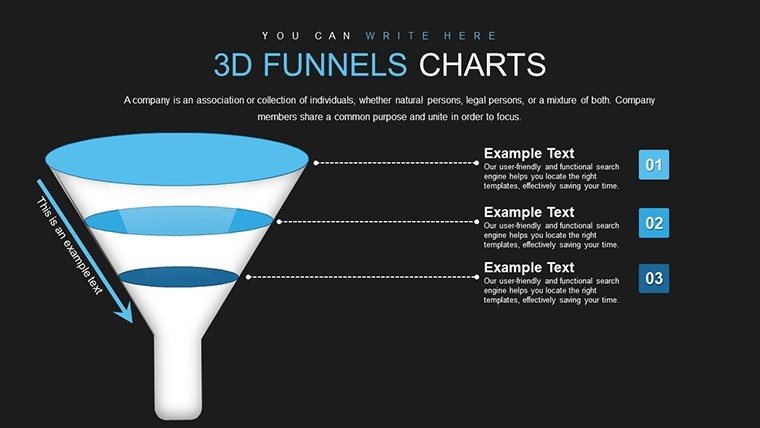


Picture this: You're in the midst of a crucial sales meeting, and instead of drowning in spreadsheets, your audience is drawn into a vivid 3D funnel that elegantly maps the customer journey from lead to loyal advocate. Our 3D Funnel PowerPoint Charts template makes this a reality, offering 32 editable slides crafted to demystify processes and spotlight opportunities. Designed for forward-thinking professionals like marketers dissecting conversion paths or managers tracking project pipelines, this template elevates your storytelling by adding dimensional flair to what could be dry data.
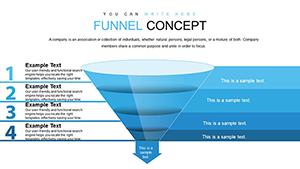
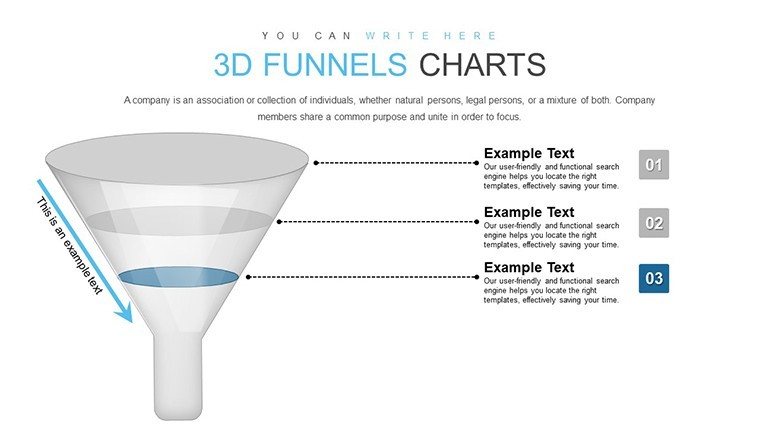
The challenge many face is conveying multi-stage processes without losing momentum - flat charts often flatten interest too. Here, 3D funnels provide perspective, narrowing visually to emphasize bottlenecks or expansions. Inspired by proven frameworks like the AIDA model in marketing, these slides help you illustrate attention, interest, desire, and action with tangible depth.
Users rave about tangible outcomes: A digital agency integrated these funnels into client reports, clarifying ROI funnels and securing renewals faster. As a marketing analyst, I appreciate how this tool bridges the gap between data and decision-making, fostering clarity in every pitch.
Essential Features for Process Mastery
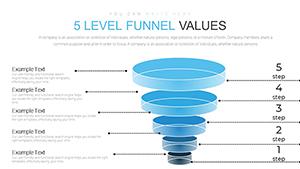
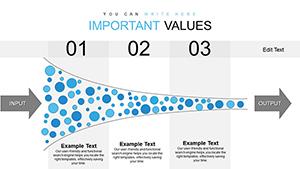
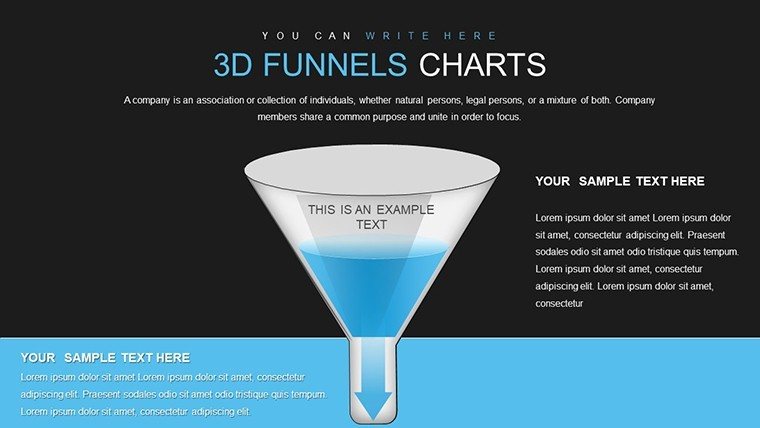
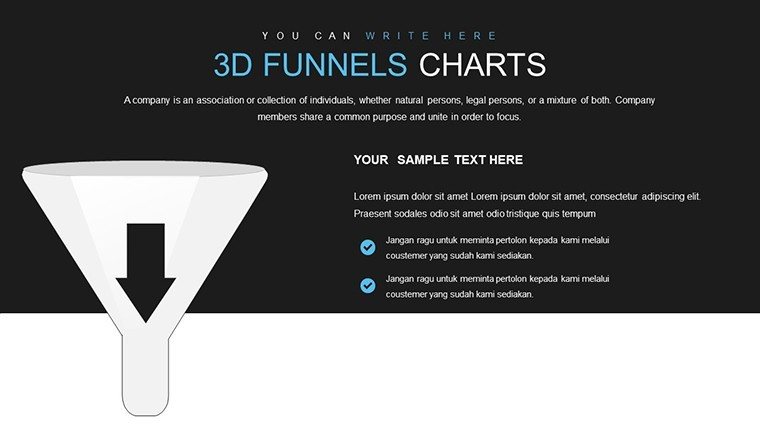
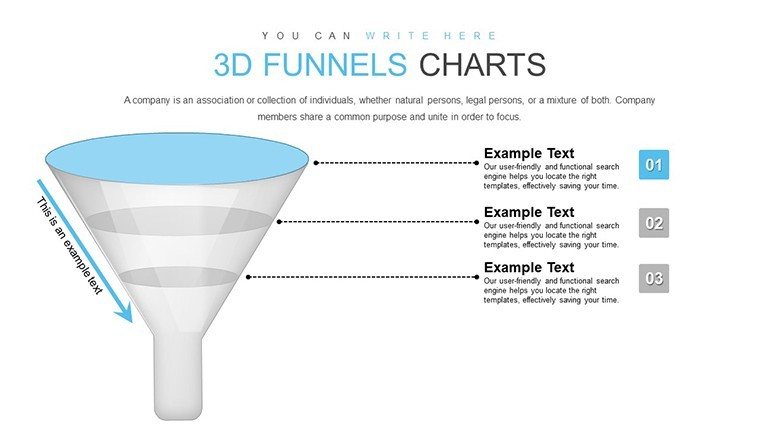
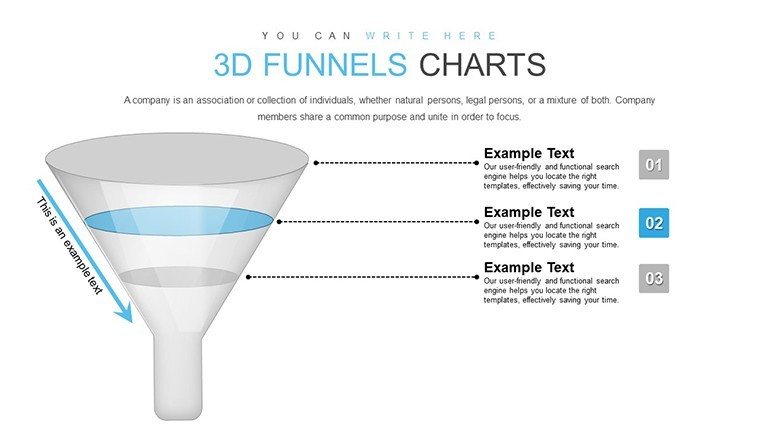
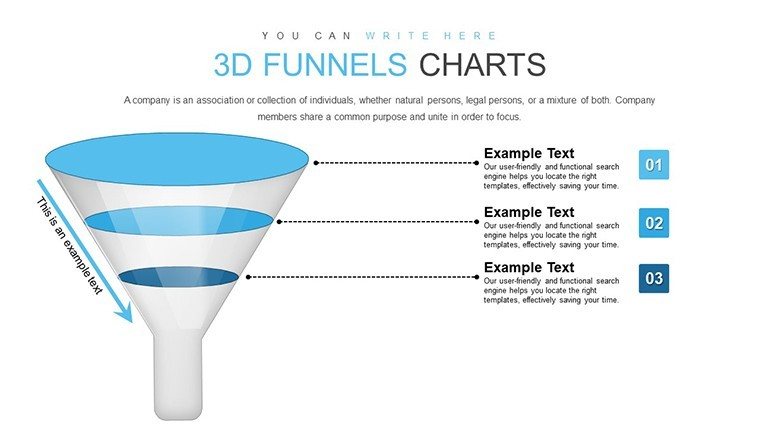
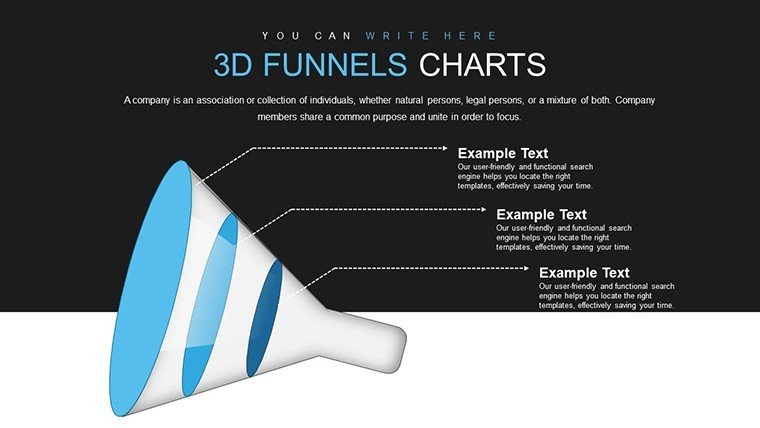
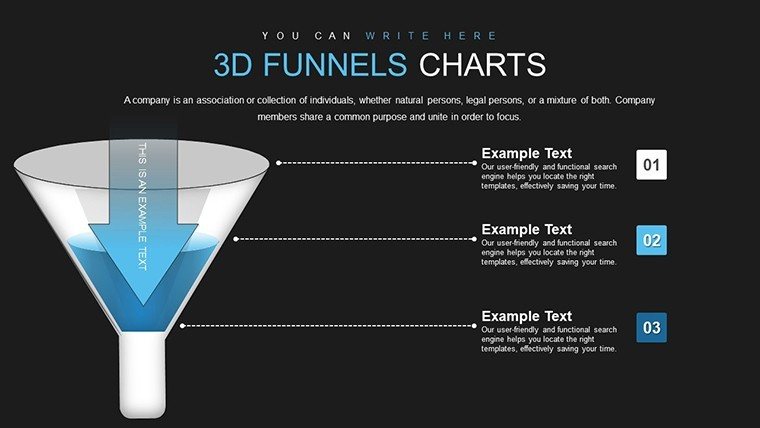
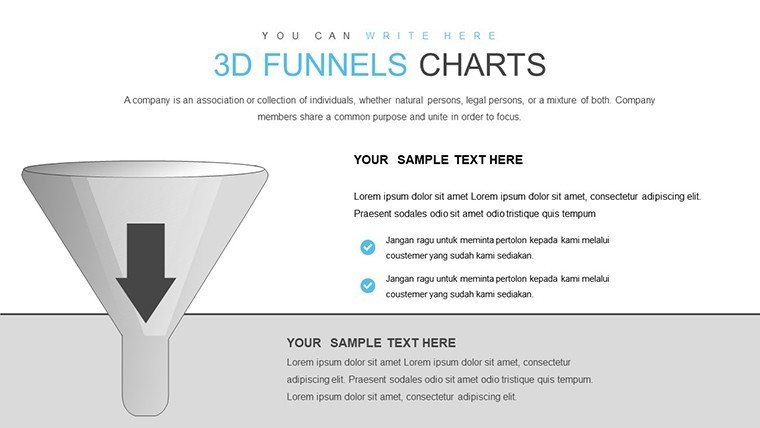
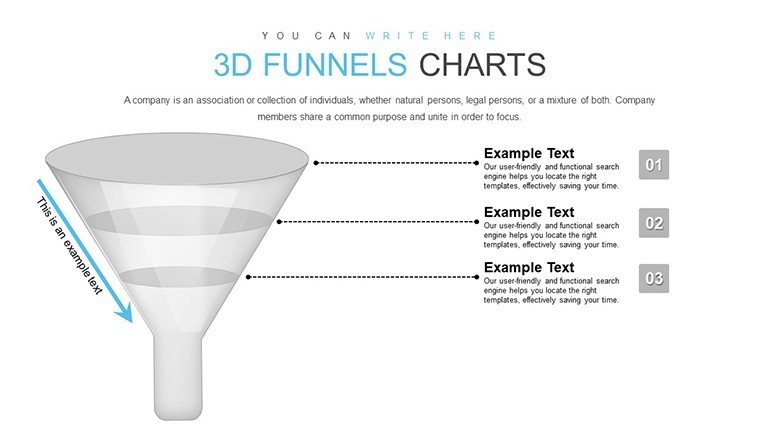
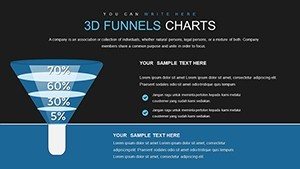
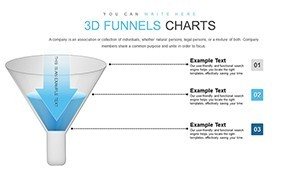
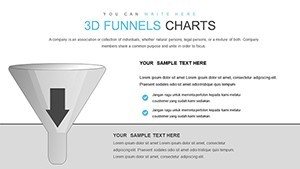
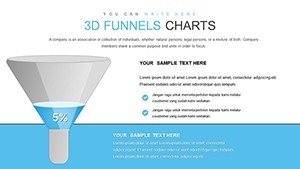
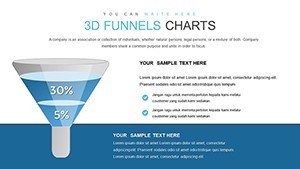
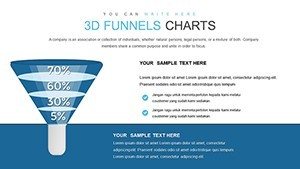
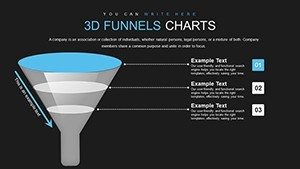
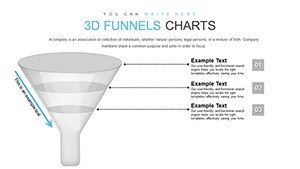
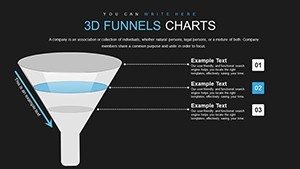
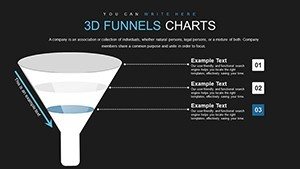
This template's strength lies in its specialized features. The 3D funnel charts are the stars, with layered designs that simulate real-world flows - wide tops for broad inputs narrowing to focused outputs. Editability is comprehensive: Resize segments, alter colors to reflect stages (e.g., green for growth), or add labels for metrics like conversion rates.
Integration is effortless, slotting into your existing decks without reformatting headaches. Compatibility with PowerPoint ensures fidelity, while options for Google Slides support on-the-go tweaks.
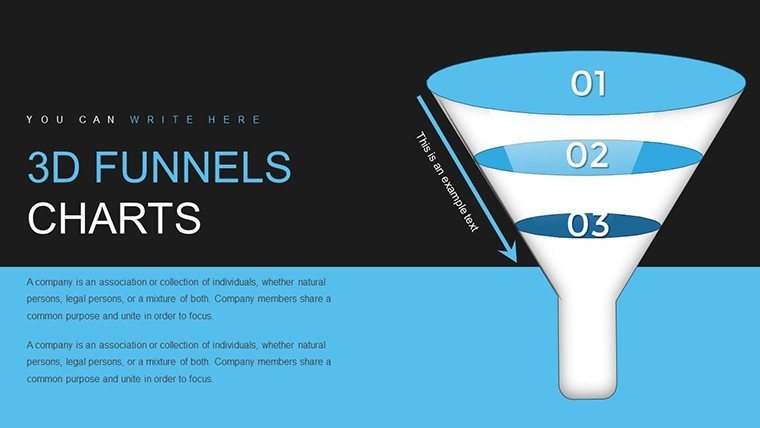
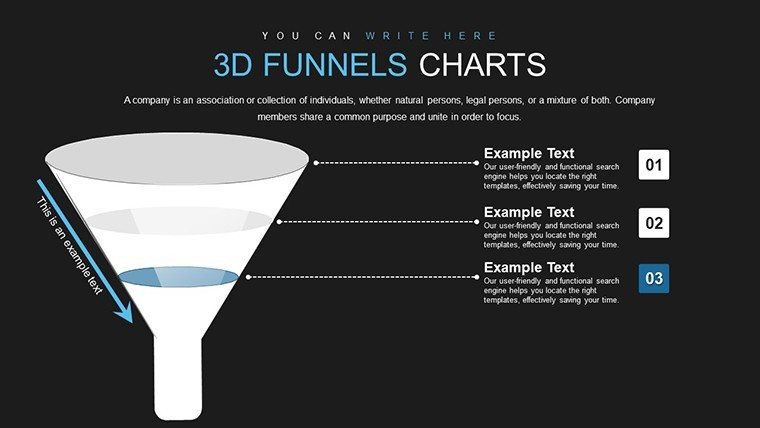
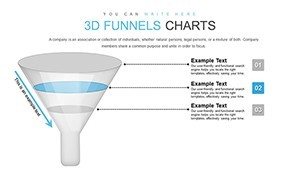
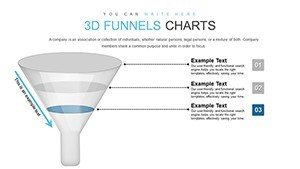
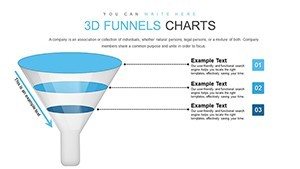
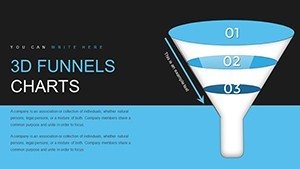
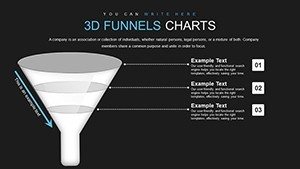
- Stage-Specific Customization: Tailor each funnel level with icons or text for detailed breakdowns.
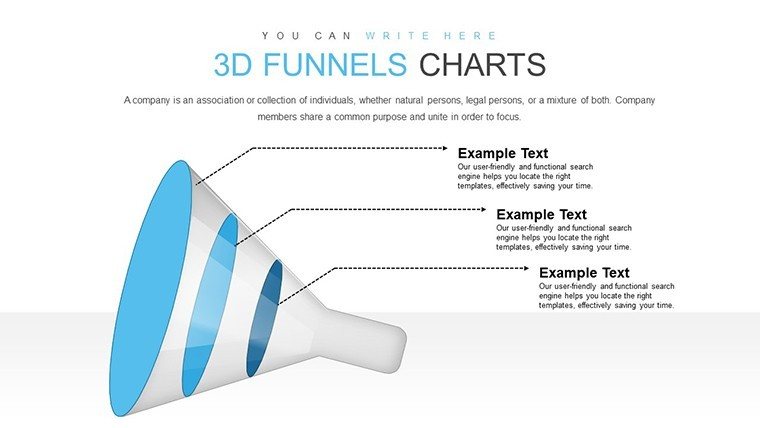
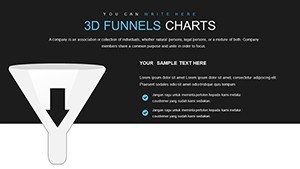
- Visual Depth Tools: Adjust shadows and angles for a polished, professional look.
- Data Linking: Connect to external sources for dynamic updates.
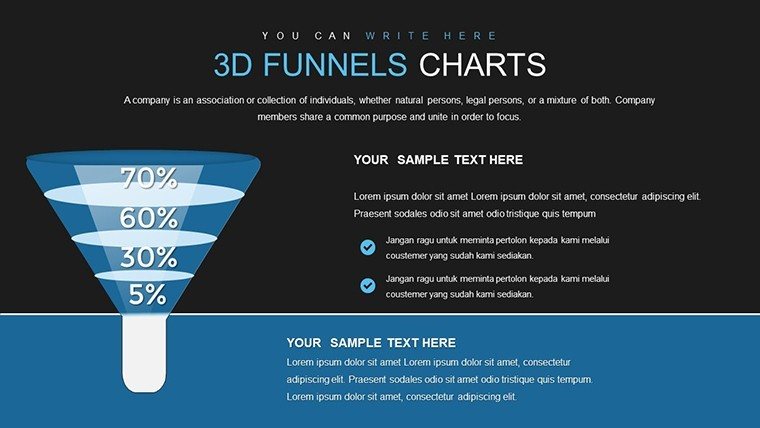
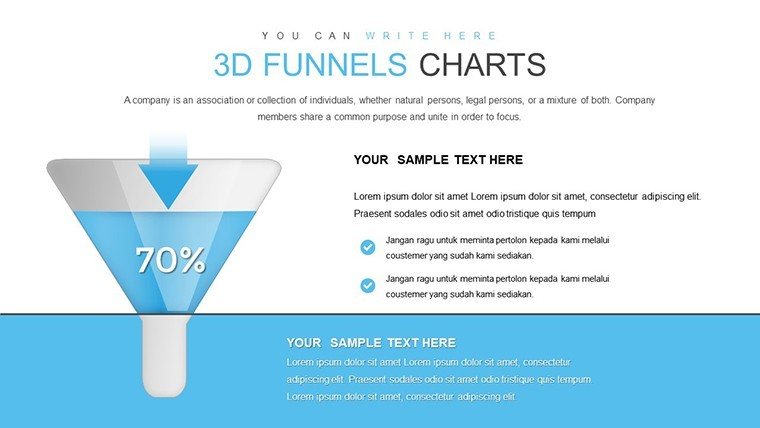
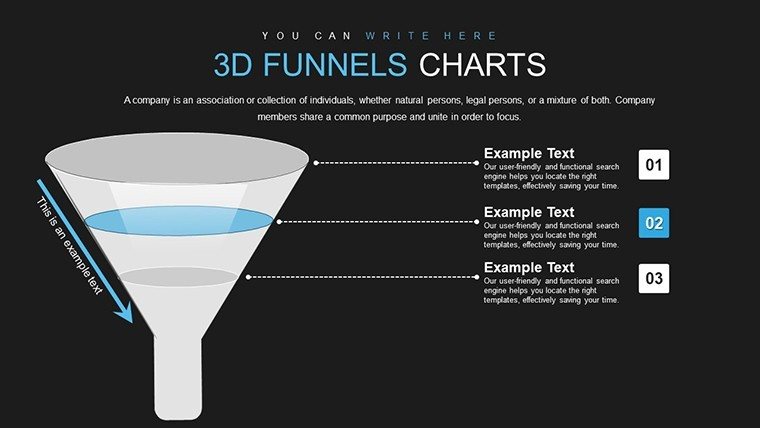
Pro advice: Use contrasting hues in funnels to highlight critical drops, a nod to heat mapping techniques in UX design for intuitive insights.
Practical Applications Across Industries
Unleash this in varied contexts. For sales teams, funnels visualize pipelines, pinpointing where leads stall and strategies shine. Consultants might employ them for SWOT analyses, funneling strengths to actionable plans.
Educators benefit too: In business courses, demonstrate supply chain logistics with funnels showing input to output efficiencies. Managers in operations use them for workflow audits, revealing inefficiencies at a glance.
- Define your process: Outline stages like awareness to purchase.
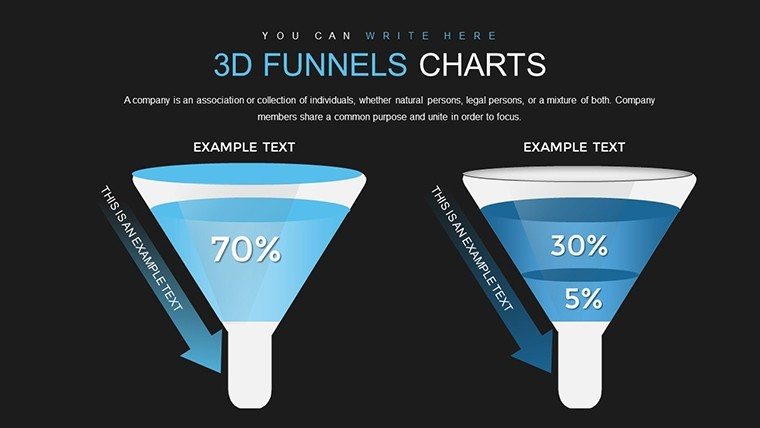
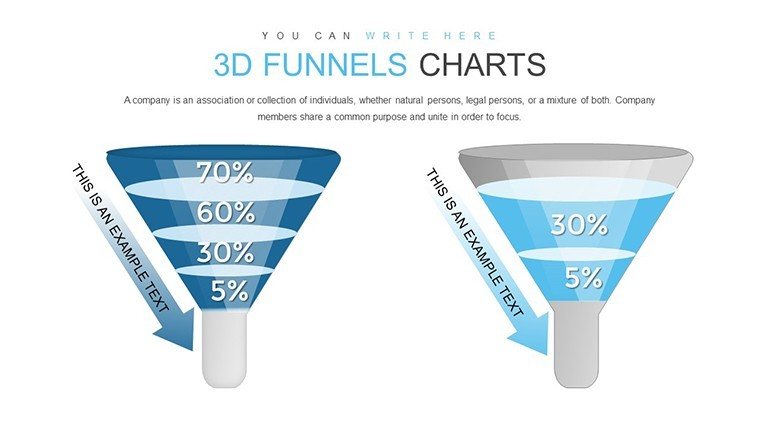
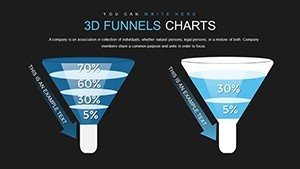
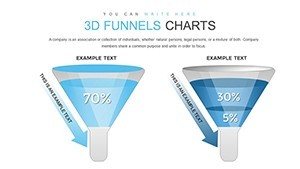
- Pick a slide: From 32, select a multi-funnel comparison for A/B testing.
- Populate data: Input metrics, watch the 3D render adjust.
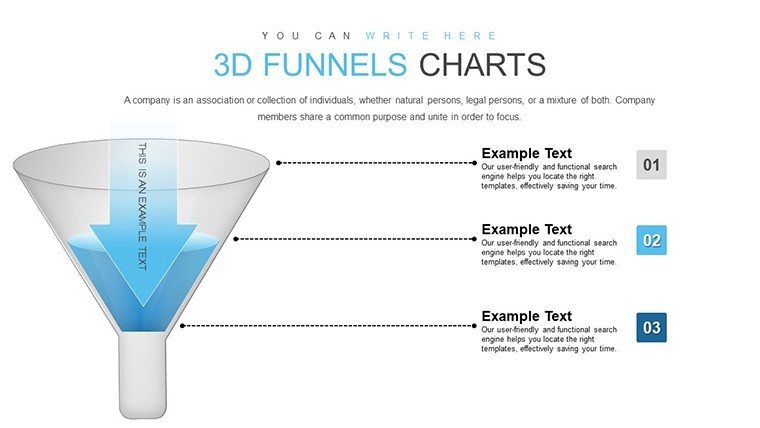
- Refine visuals: Add arrows or notes for emphasis.
- Present with confidence: Use transitions to 'fill' the funnel progressively.
Outpacing basic funnels, this 3D version adds immersion lacking in 2D alternatives. Blend with apps like Salesforce for CRM data pulls or Miro for brainstorming integrations.
Maximizing Impact with Layered Insights
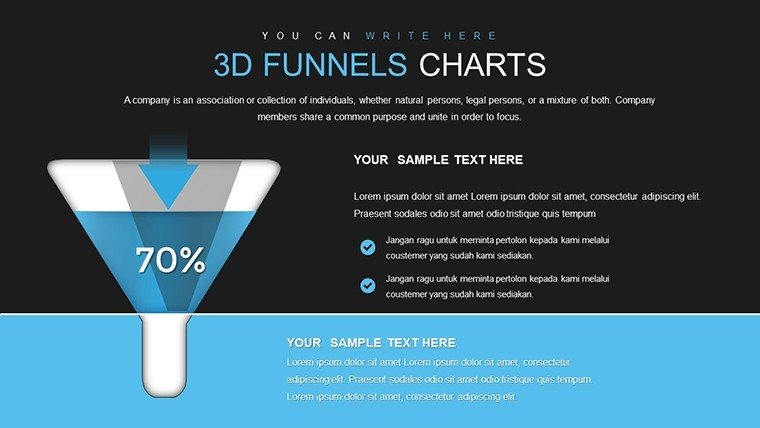
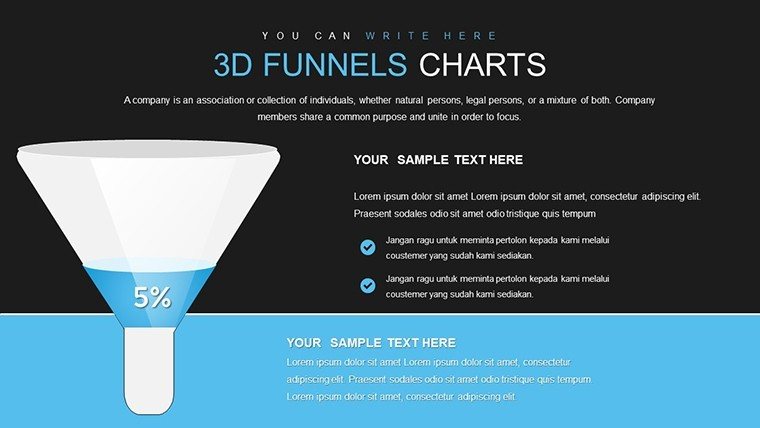
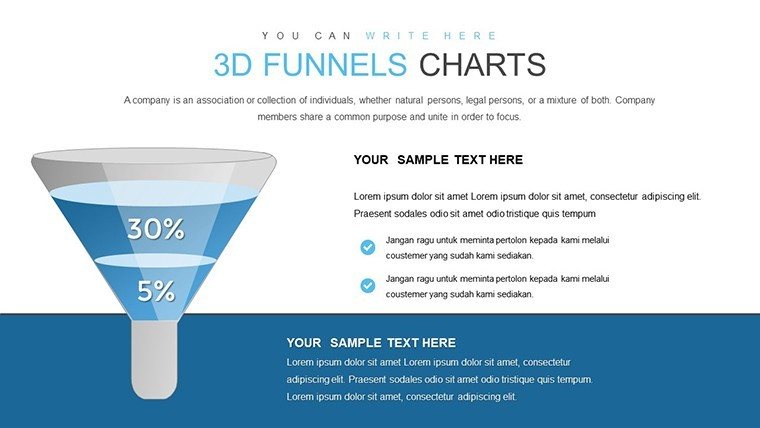
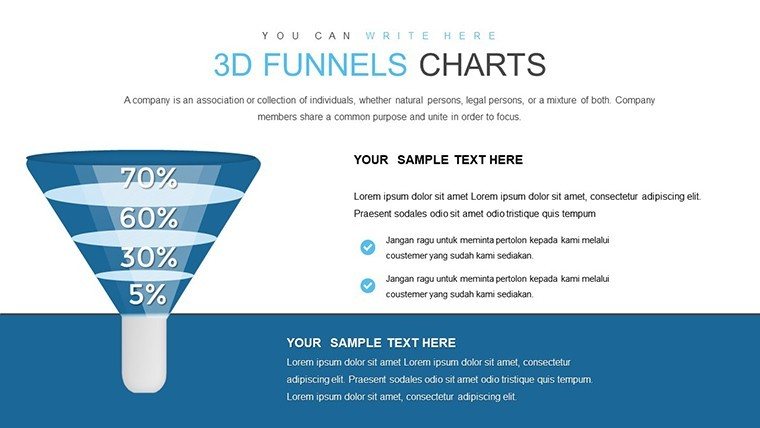
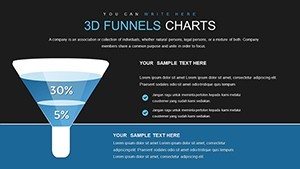
Layer additional elements like percentage indicators within funnels for quantifiable storytelling. In a project update, this could mean showing phase completions, building trust through transparency.
Adapt for virtual settings: Animate funnel fills to maintain remote audience focus.
Elevating Your Narrative Game
This template excels by focusing on process visualization, outshining generic charts with targeted 3D precision. A startup used it in pitch decks to funnel investor questions into commitments, proving its persuasive power.
At $20, it's an investment in efficiency, with reusable designs cutting creation time. Invitations like "Test a funnel slide" spark curiosity, leading to the ultimate: Transform your processes visually - grab it now.
Ultimately, great visuals don't just inform - they inspire. With 3D funnels, guide your audience through journeys that stick. Step up your game today.
Frequently Asked Questions
How do I edit the funnel stages?
Simply select segments and adjust sizes, colors, or labels directly in PowerPoint.
Is it suitable for non-sales uses?
Yes, perfect for any staged process, like education or operations.
Does it work with Google Slides?
Absolutely, with full editability preserved.
Can I animate the funnels?
Yes, add builds to simulate filling or narrowing.
What if my data changes?
Link to sources for easy updates without redesigns.
Why choose 3D over 2D funnels?
3D adds depth for more engaging, memorable visuals.