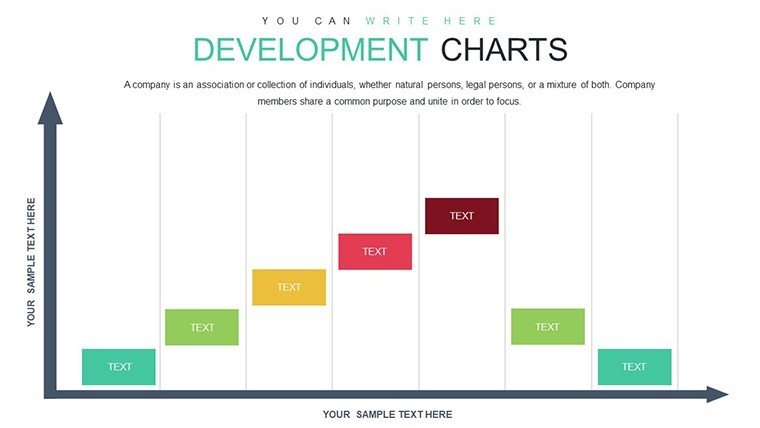
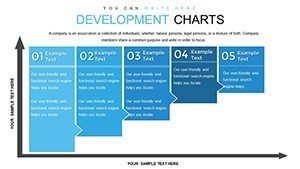
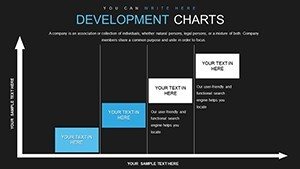
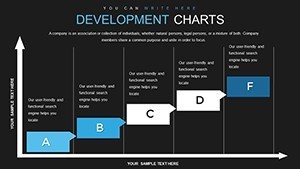
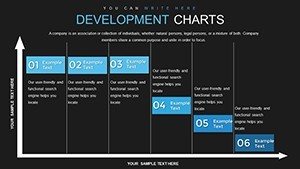
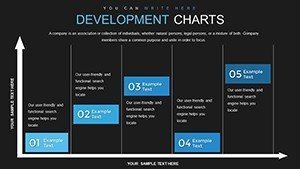
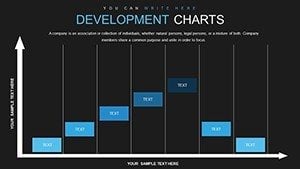
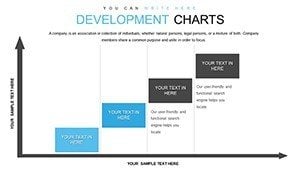
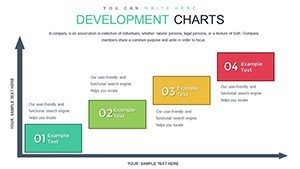
Development PowerPoint Charts Template


Type: PowerPoint Charts template
Category: Tables
Sources Available: .pptx
Product ID: PC00781
Template incl.: 33 editable slides
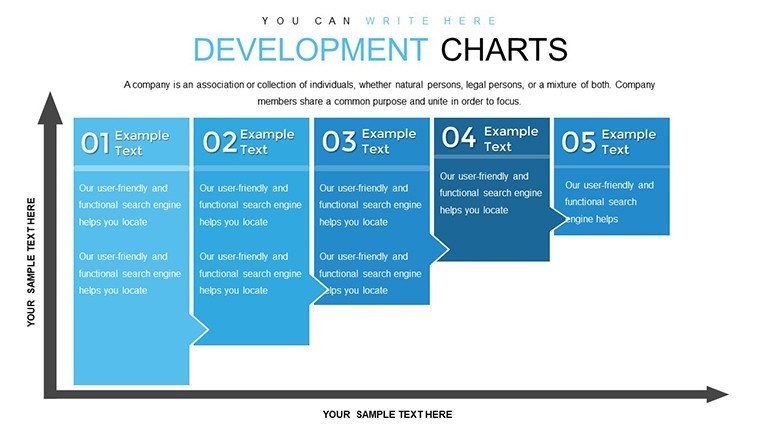
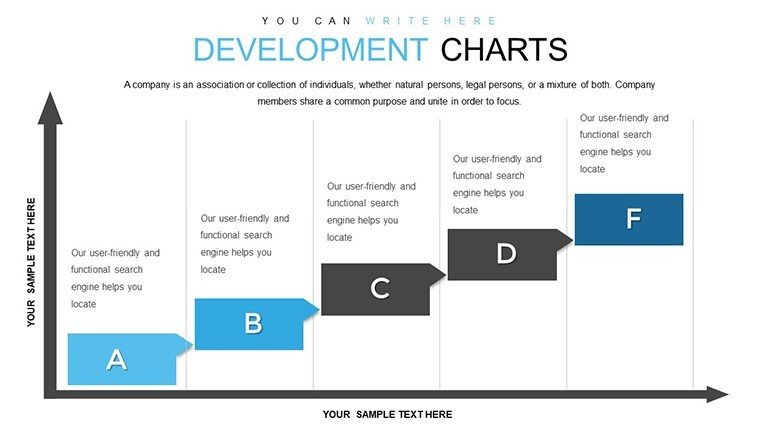
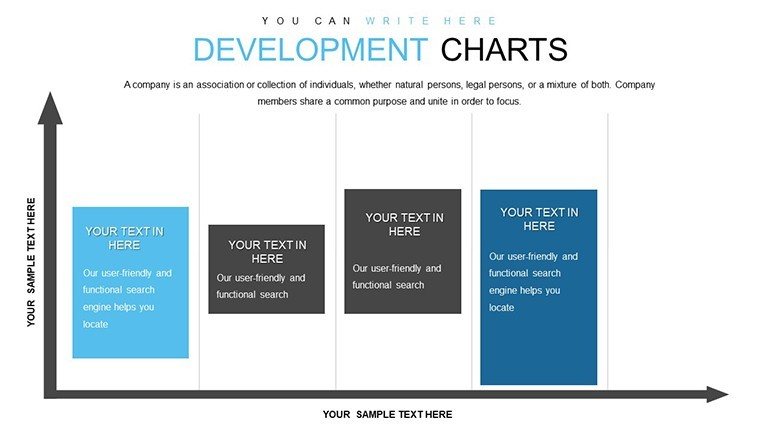
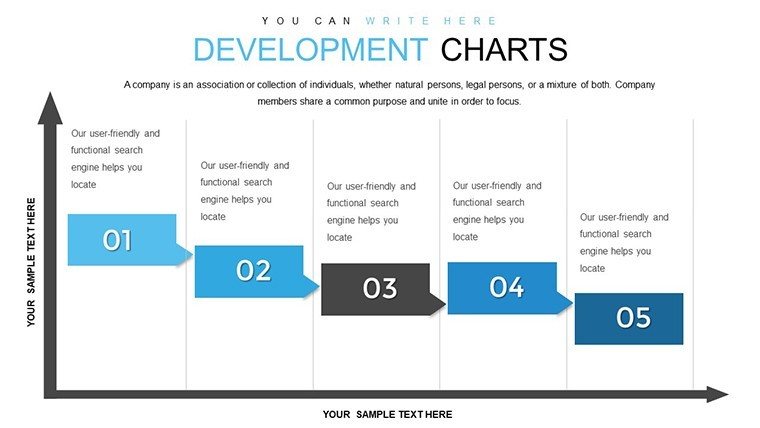
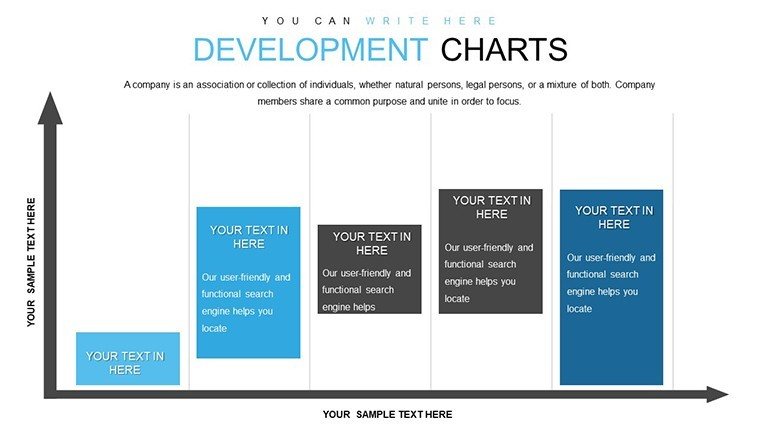
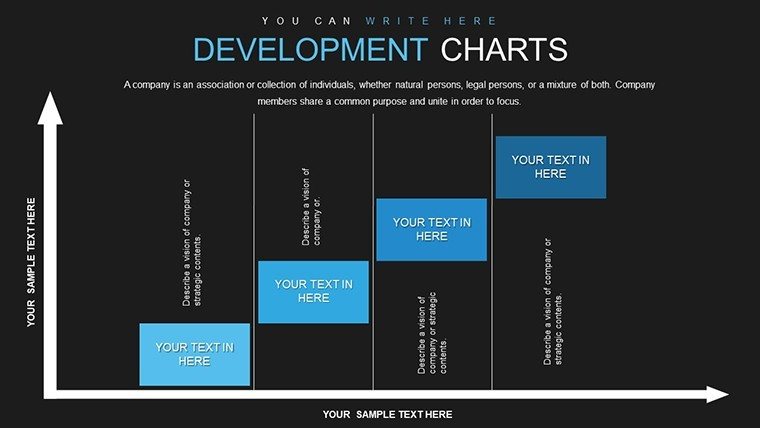
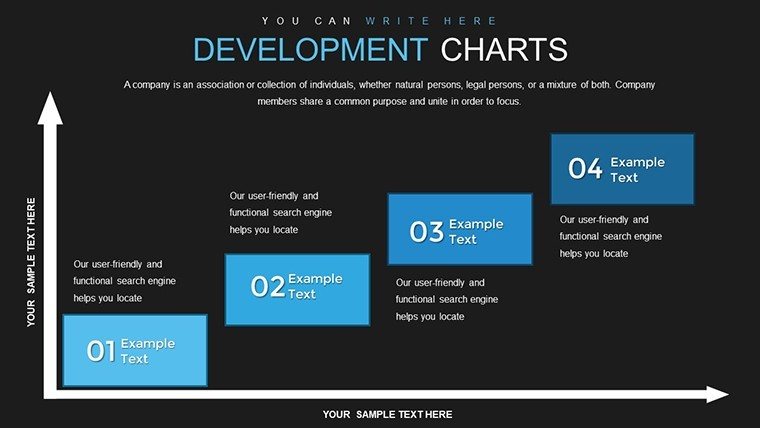
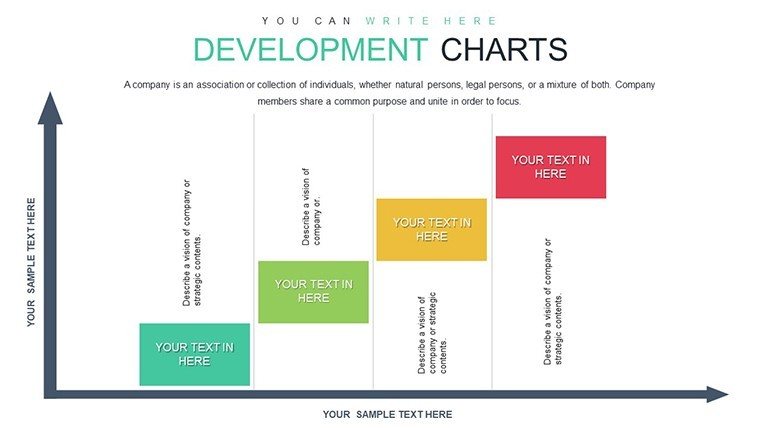
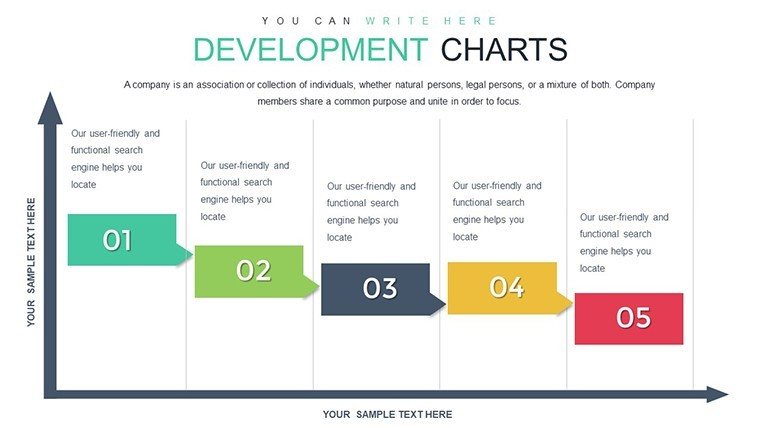
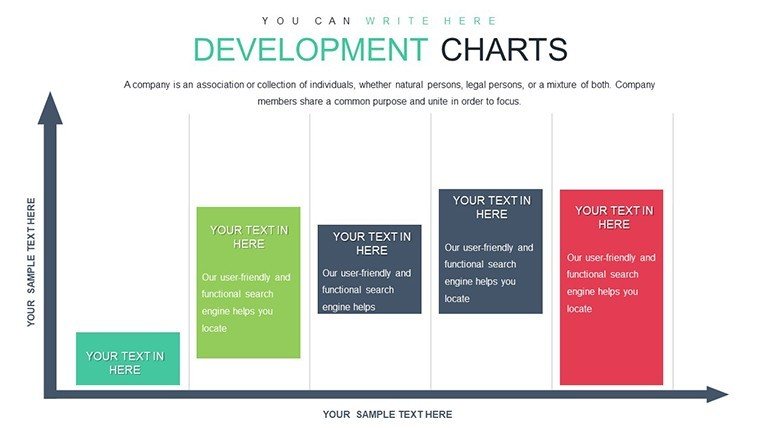
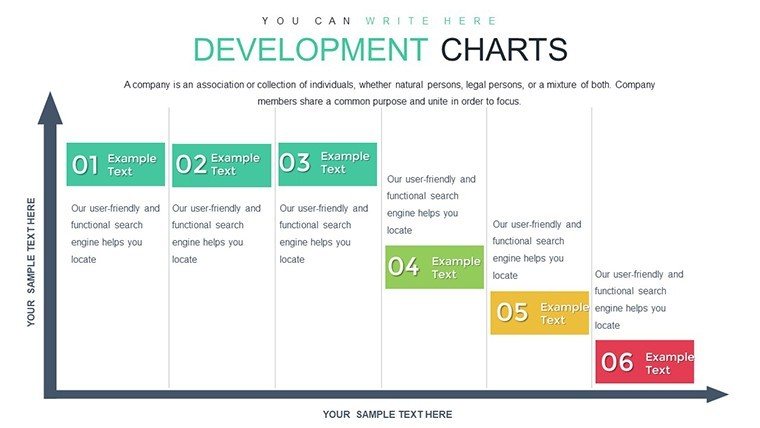
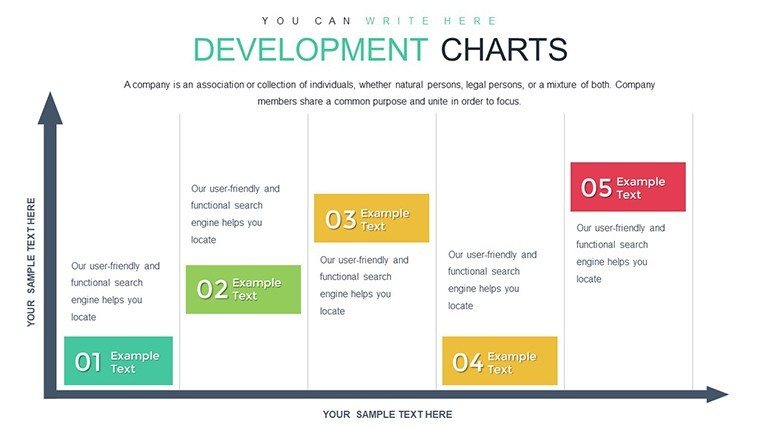
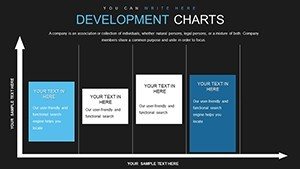
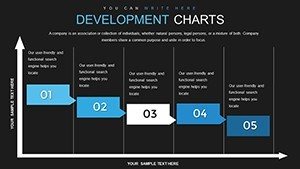
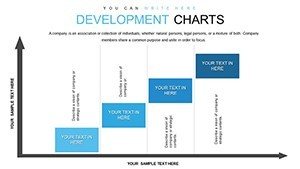
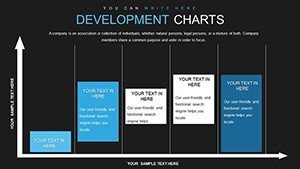
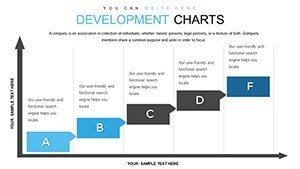
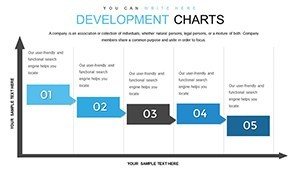
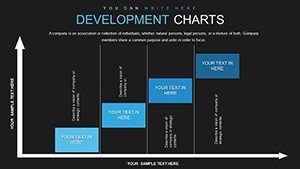
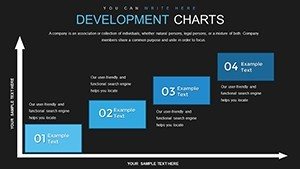
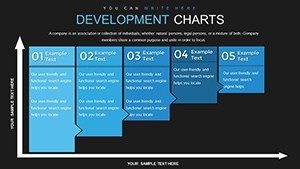
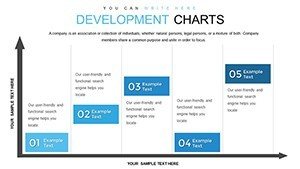
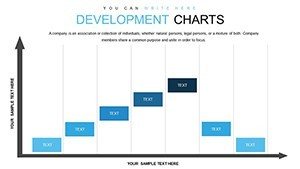
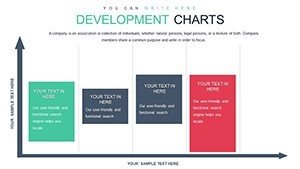
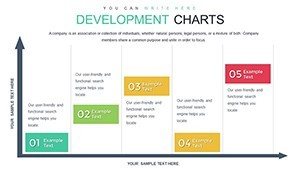
Development in business often involves tracking progress, analyzing trends, and presenting insights that drive decisions. Our Development PowerPoint Charts Template equips you with 33 editable slides focused on tables and charts, perfect for turning raw data into compelling stories. Whether you're monitoring project milestones or forecasting growth, this template's clean designs and customizable features make it indispensable for professionals seeking to communicate development effectively. Say goodbye to overwhelming spreadsheets and hello to visuals that clarify and convince.
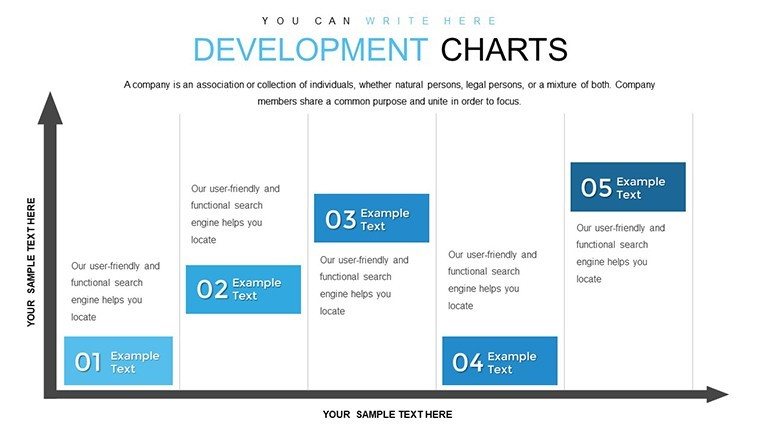
Consider the challenge of presenting quarterly development reports: Data overload can obscure key messages. This template counters with intuitive table layouts and chart varieties, from line graphs showing evolution to matrices for comparative analysis. Fully editable, you can infuse your brand's essence, ensuring every slide feels like an extension of your expertise.
Mastering Data Visualization in Development Contexts
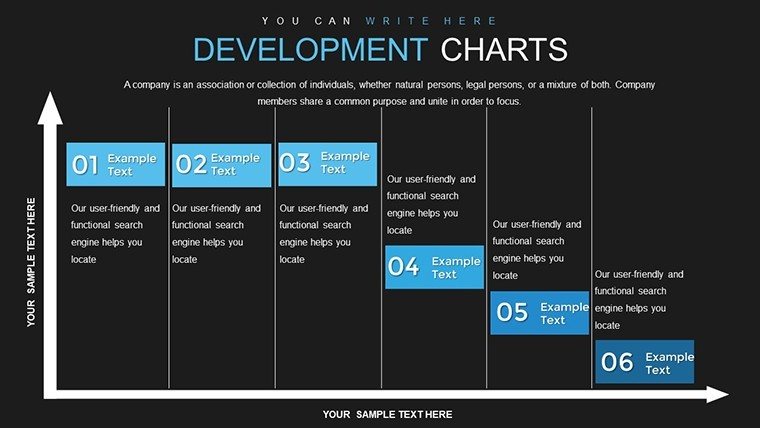
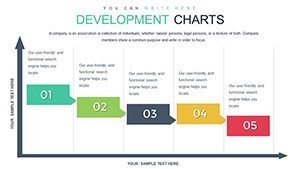
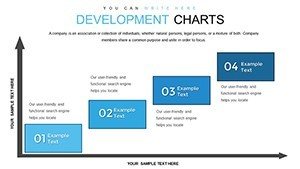
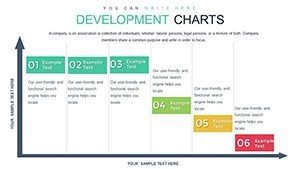
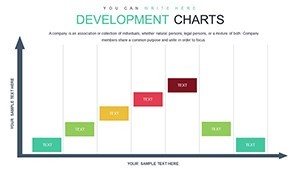
At its heart, this template excels in data clarity. Use the development timeline charts to map project phases, with editable milestones that adapt to agile methodologies. For instance, software developers can customize Gantt-style tables to reflect sprint progress, aligning with standards from the Project Management Institute (PMI).
Educators utilize it for curriculum development, plotting course outlines in tabular formats that highlight learning objectives. Marketers track campaign development with pie charts segmenting audience growth, inspired by real campaigns like those from Coca-Cola that emphasize measurable evolution.
Consultants appreciate the professionalism for client reports. A matrix table comparing pre- and post-development metrics can underscore ROI, much like Bain & Company's use of data tables in strategy documents.
Essential Features for Development Pros
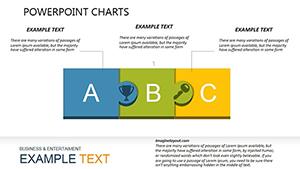
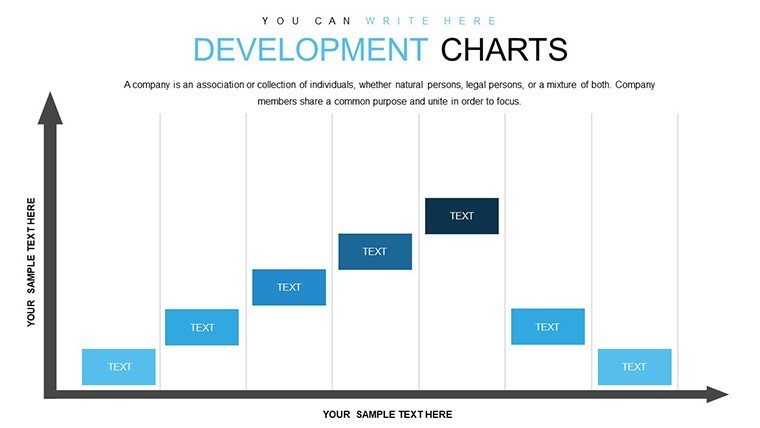
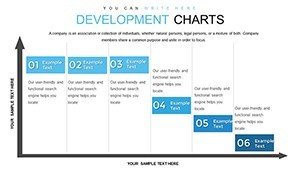
- Varied Chart Types: Tables, lines, bars, and more for comprehensive coverage.
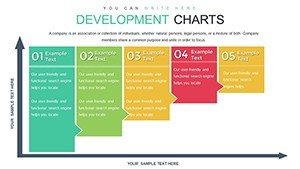
- Customization Freedom: Alter colors, fonts, and data sets with ease.
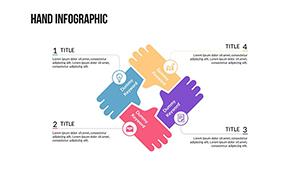
- Intuitive Layouts: Clean designs that prioritize readability and impact.
- Broad Compatibility: Functions in PowerPoint and Google Slides without hitches.
- Expert Craftsmanship: Built on principles of effective data presentation.
Unlike generic options, this template integrates seamless data import, reducing prep time. Incorporate LSI like "project tracking charts" organically for better search rankings.
Tailored Applications for Diverse Users
Business pros streamline development reports, using heat maps to highlight risk areas. Educators make abstract concepts concrete, like economic development models with comparative tables.
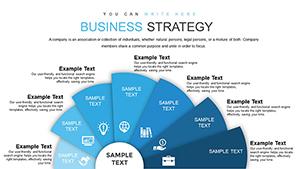
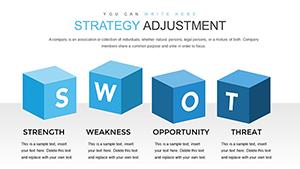
Marketers illustrate strategy development, with funnel charts showing lead progression. Consultants present advisory development plans, leveraging SWOT tables for depth.
Optimizing Your Workflow with This Template
- Begin Customization: Select and apply your color scheme.
- Populate Data: Insert figures into pre-set tables.
- Enhance Visuals: Add labels and legends for clarity.
- Incorporate Feedback: Edit based on team input.
- Deliver Confidently: Present with polished, professional slides.
Superior to basic tools, it offers aesthetic sophistication. Add wit where fitting, like "developing your presentation skills" quips.
Pro Tips for Development Presentations
Reference authoritative sources like Gartner reports for credibility. Short sentences, bold terms, and lists aid UX. Alt tags: "Development table chart for project tracking."
Elevate your development narratives - secure this template now for transformative results.
Frequently Asked Questions
How many chart types are available?
A wide selection including tables, graphs, and matrices across 33 slides.
Can I customize fonts and colors?
Yes, complete freedom to match your branding.
Is it ideal for educators?
Perfect for making lessons on development topics engaging.
What format is the download?
.pptx, compatible with major presentation software.
Does it support data import?
Yes, easily integrate from Excel or other sources.
Are there any design tips included?
The template embodies best practices, with room for your enhancements.