5 Stage Process PowerPoint Template - Fully Editable & Instant Download


Type: PowerPoint Charts template
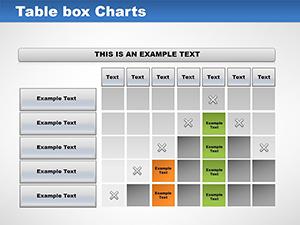
Category: Tables
Sources Available: .pptx
Product ID: PC00758
Template incl.: 26 editable slides
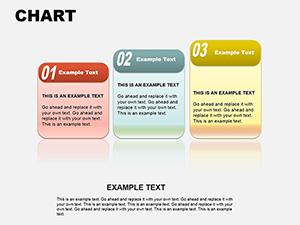
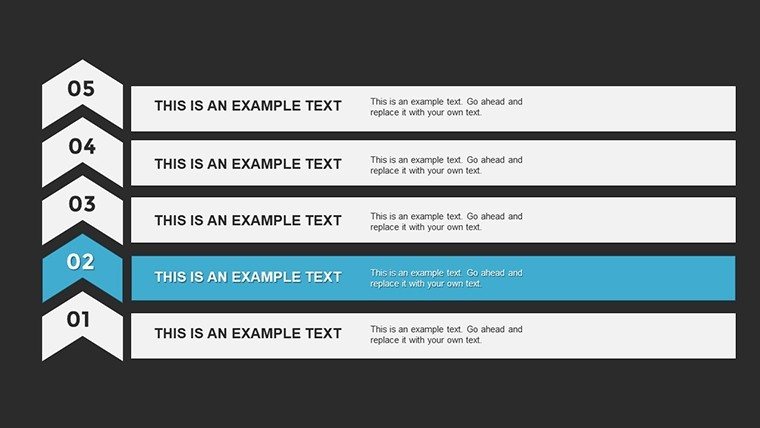
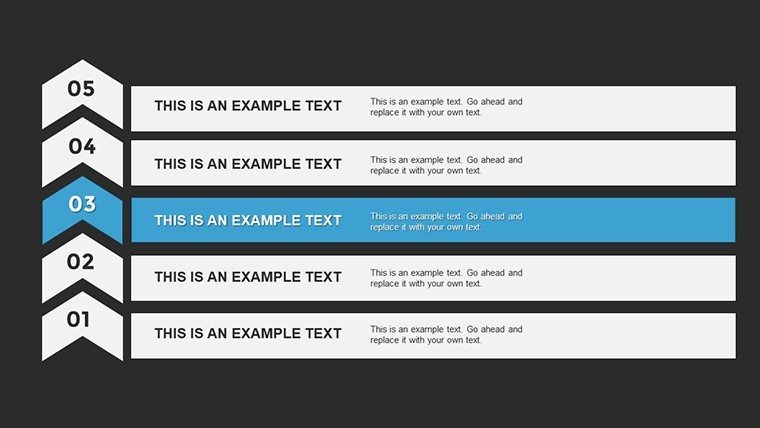
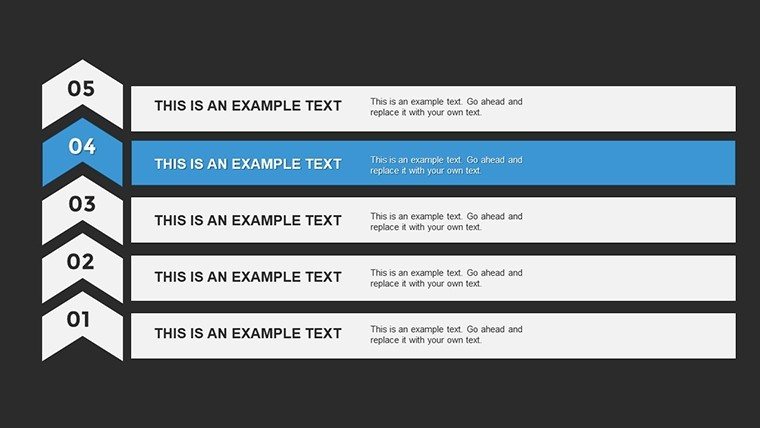
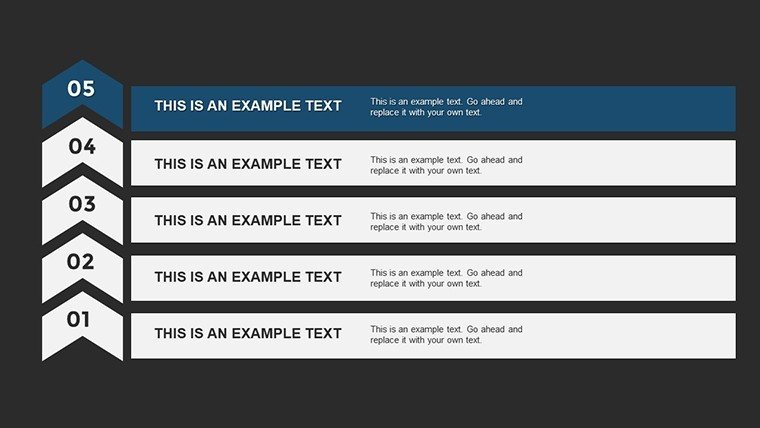
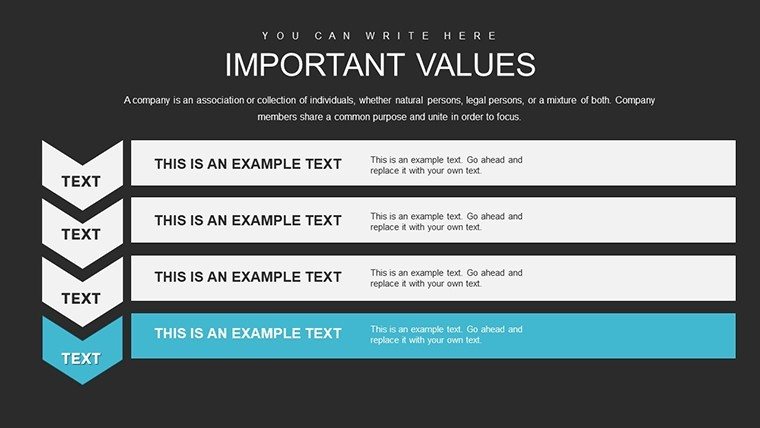
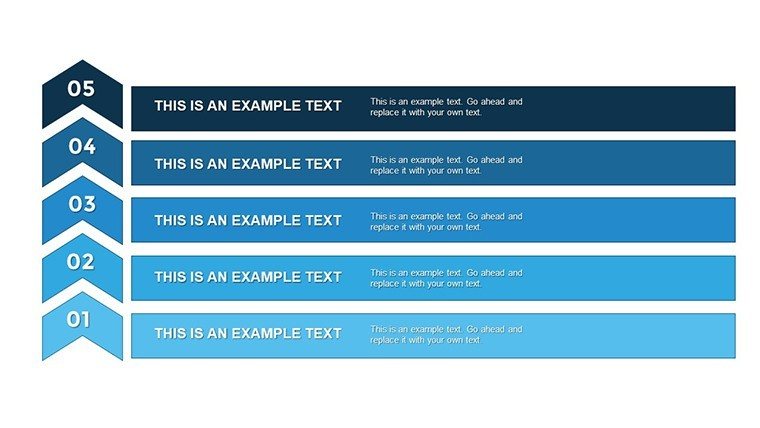
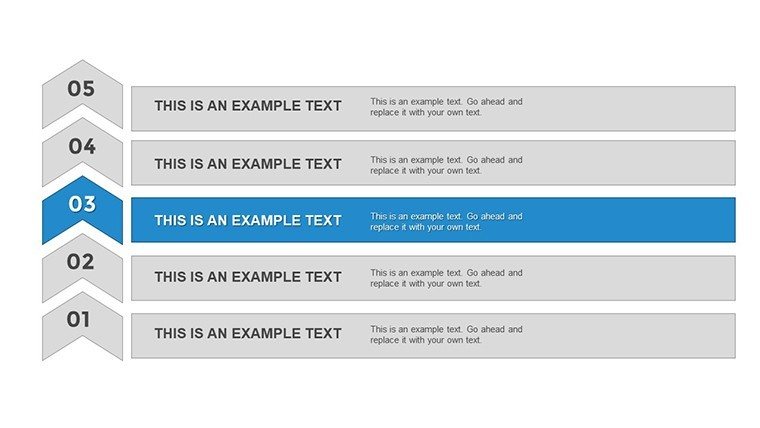
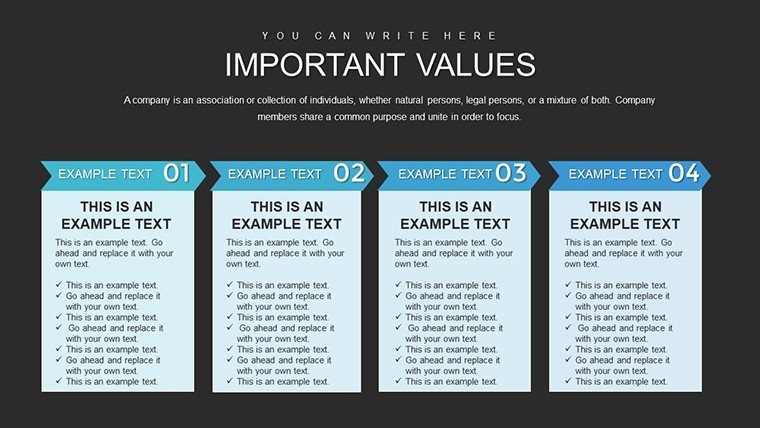
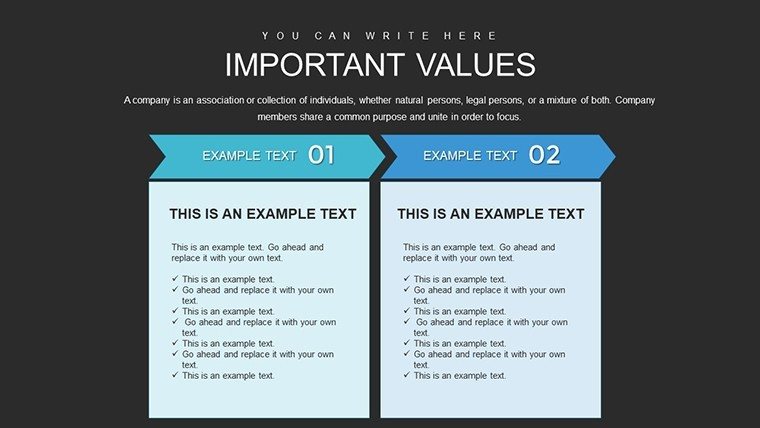
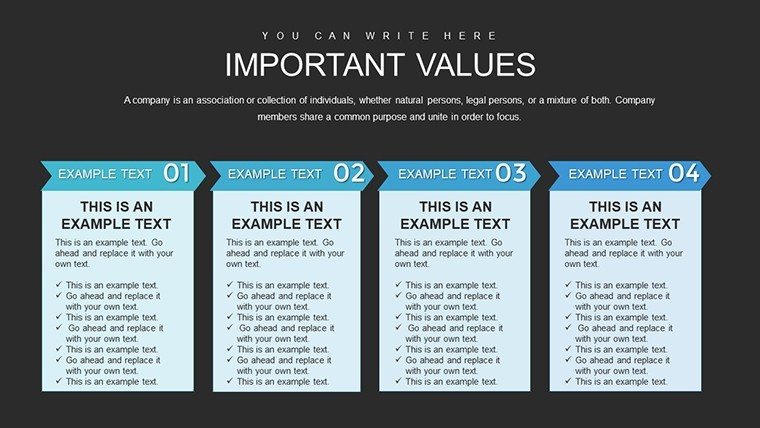
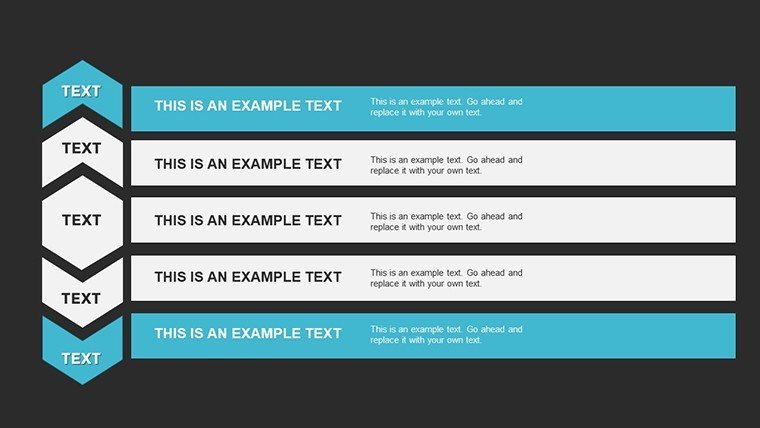
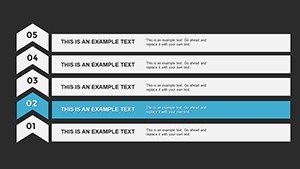
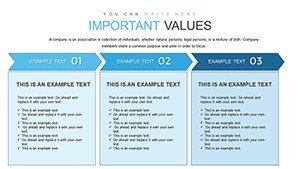
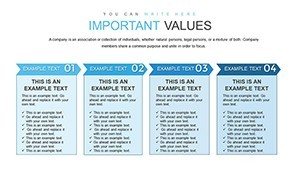
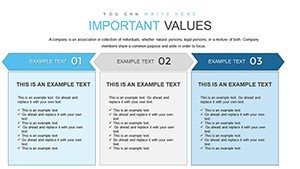
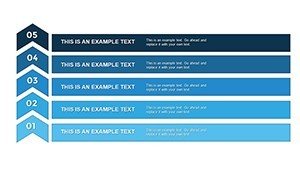
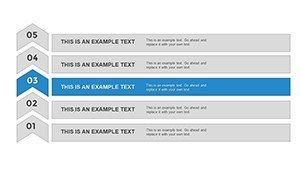
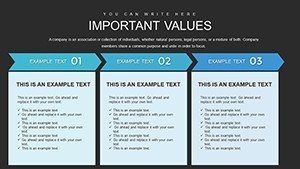
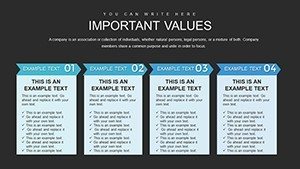
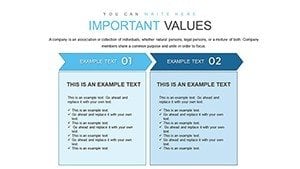
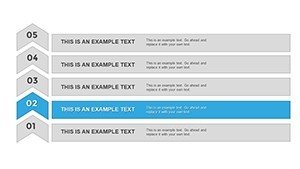
Guide your audience through sequential processes, growth journeys, or strategic progressions with clarity and visual flow. This 5 stage PowerPoint template provides a professional horizontal layout that naturally directs attention from initial steps to final outcomes, making complex sequences easy to follow and remember.
Perfect for professionals presenting project lifecycles, customer journeys, recruitment processes, or any five-phase framework that requires logical progression and visual coherence.
Key Features
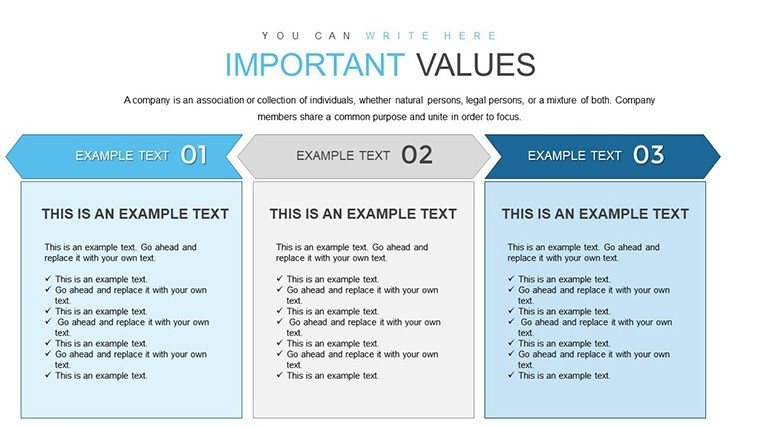
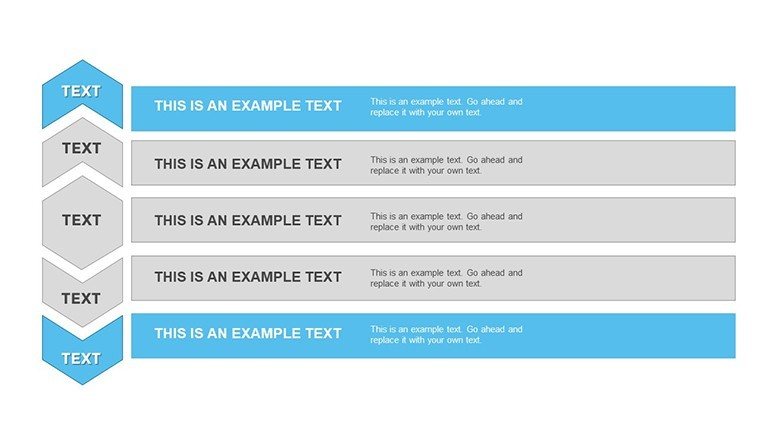
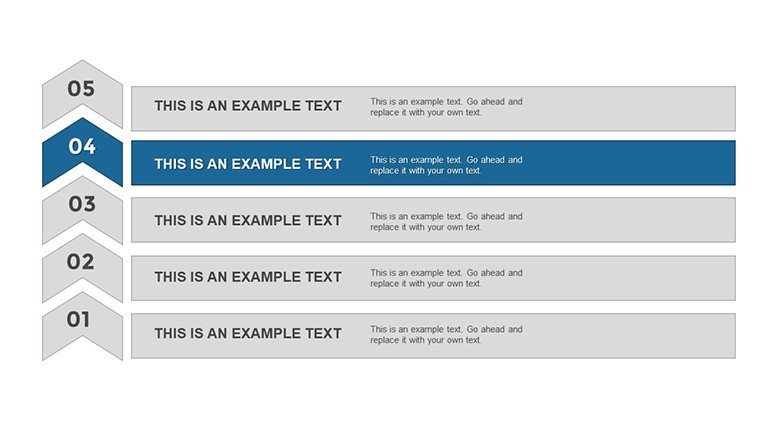
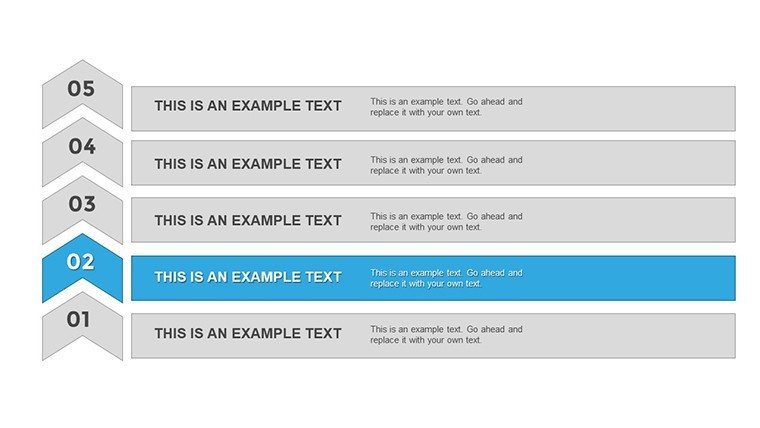
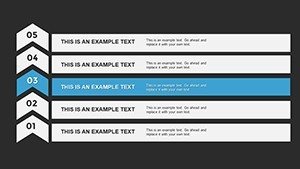
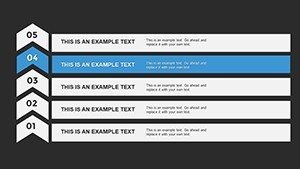
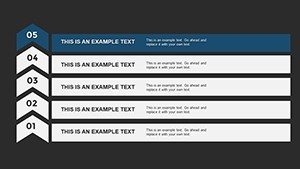
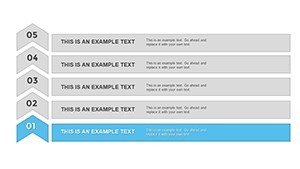
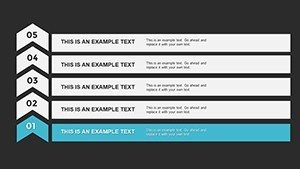
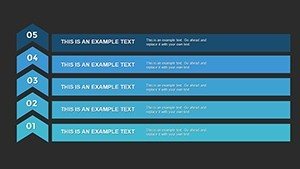
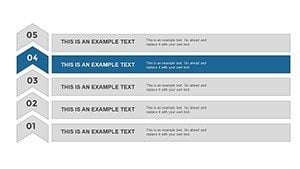
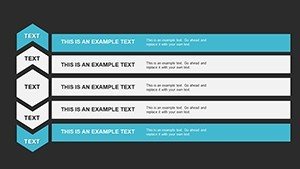
- Clean horizontal 5-stage layout with adaptive color gradients
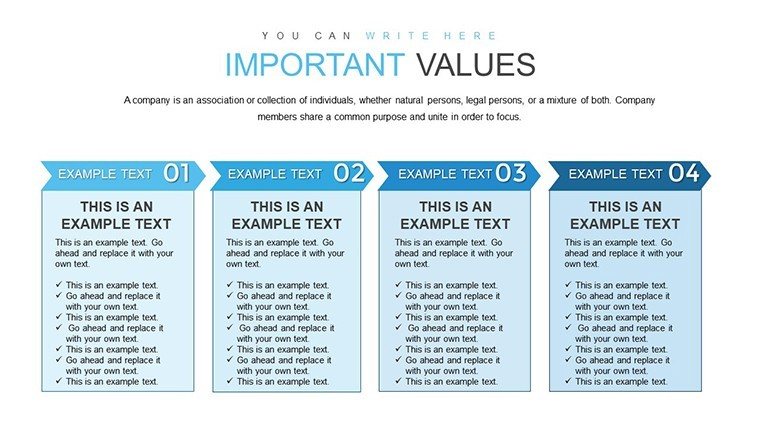
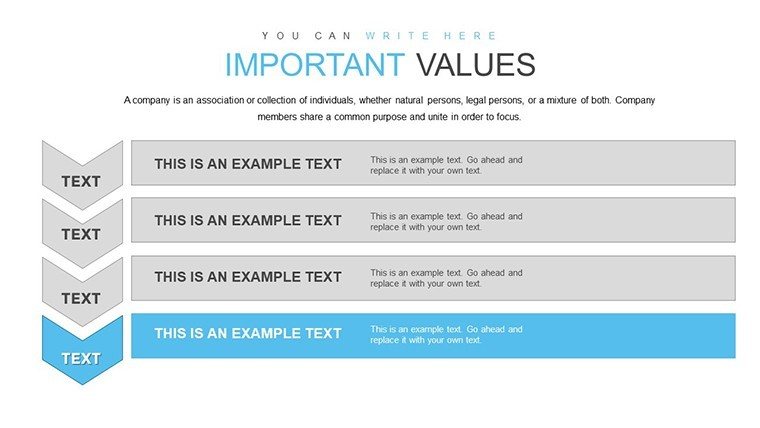
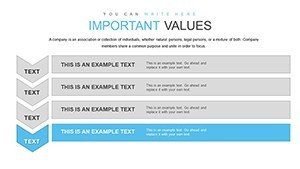
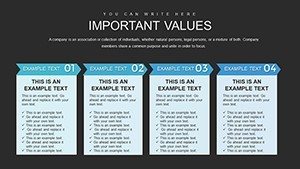
- Integrated icons and labels for each stage
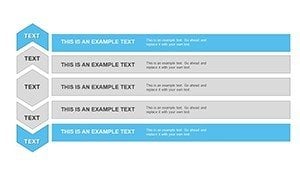
- Fully editable text, colors, icons, and connecting elements
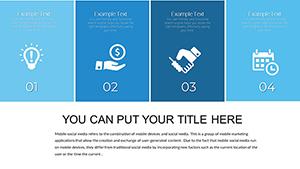
- Modern design optimized for left-to-right reading patterns
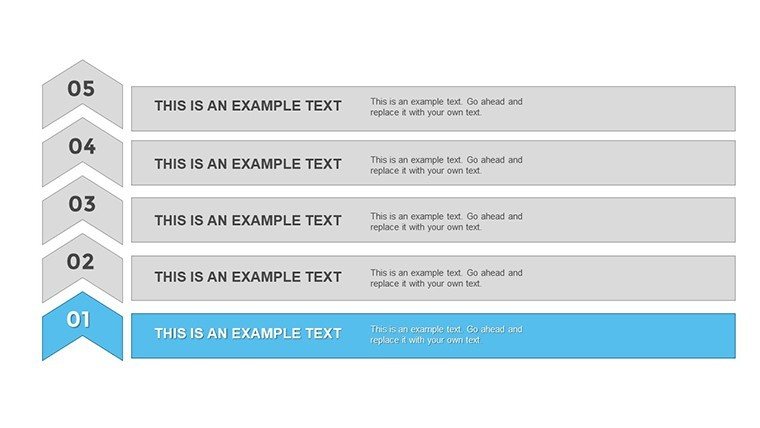
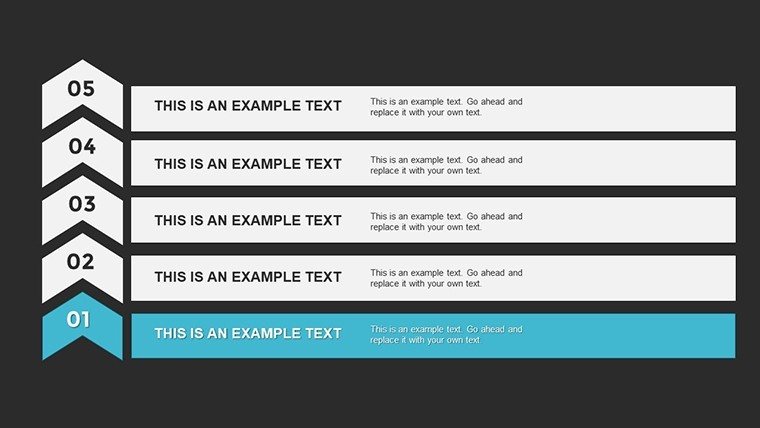
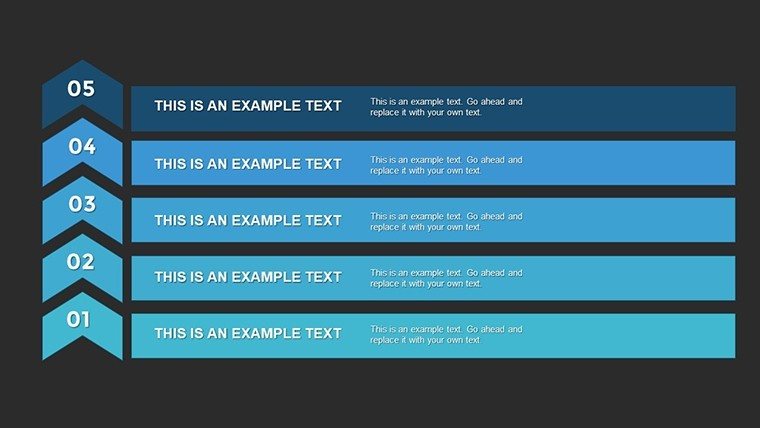
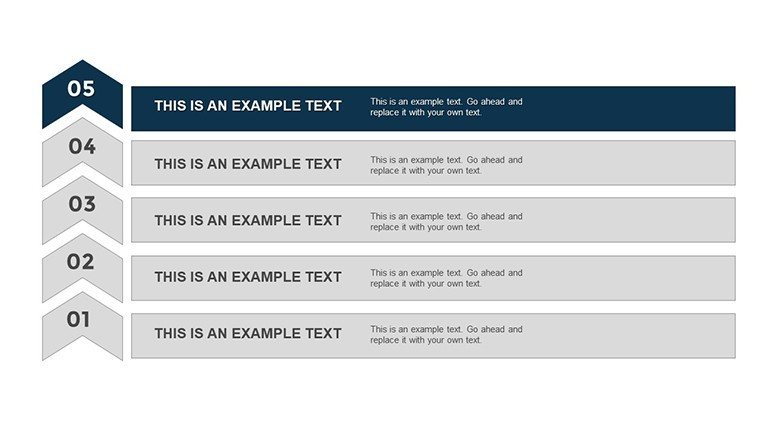
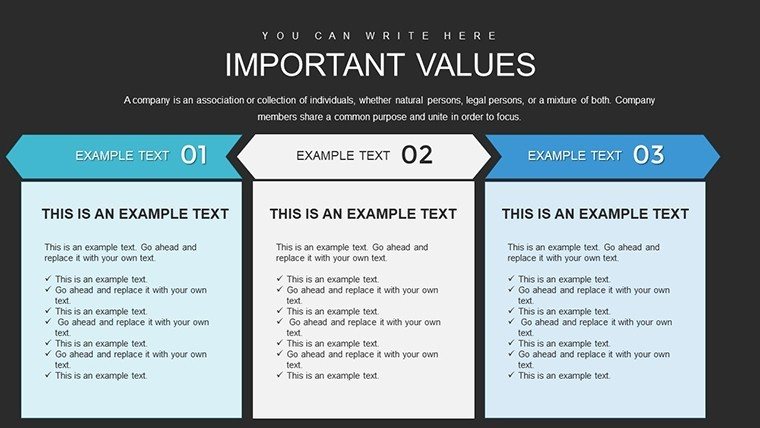
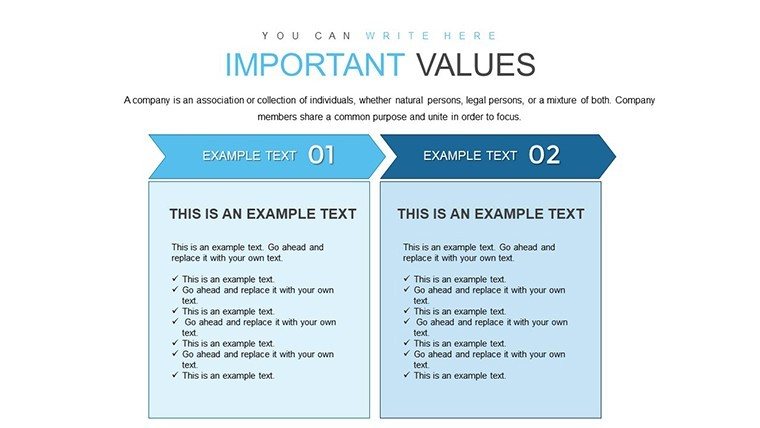
- Multiple variations for different presentation contexts
Benefits of Structured Process Visualization
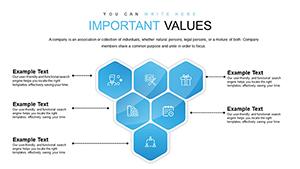
A well-designed 5-stage diagram strikes the ideal balance between detail and simplicity, allowing audiences to grasp the overall journey while understanding each phase. This template ensures your process presentations are memorable, logical, and professionally polished, helping stakeholders follow your narrative without confusion.
The visual progression reinforces your message and improves information retention during reviews and decision-making sessions.
Professional Use Cases
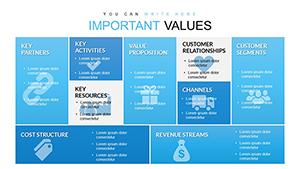
Project Management: Map project phases from initiation to completion, highlighting milestones and dependencies for team alignment.
Marketing Strategy: Illustrate conversion funnels or customer journey stages to demonstrate acquisition and retention processes.
HR Processes: Present recruitment pipelines or employee development paths with clear stage definitions and requirements.
Business Development: Show product launch phases or market expansion strategies with professional visual sequencing.
How to Customize Your 5 Stage Diagram
Select the layout variation that best fits your content, then edit stage titles and descriptions directly in the text placeholders. Replace or modify icons to better represent each phase, adjust color gradients to match your brand, and resize elements as needed. The connected structure maintains alignment automatically during edits.
For strongest impact, use progressive color intensity from stage 1 to 5 and keep descriptions concise for quick comprehension.
Frequently Asked Questions
Can I modify the number of stages if I need more or fewer?
While optimized for 5 stages, the template uses editable shapes that allow you to duplicate or remove stages and adjust connections accordingly.
Is this template suitable for timeline presentations?
Yes, the horizontal flow and sequential design make it excellent for timelines, project roadmaps, or any chronological progression.
Are the icons and colors fully customizable?
Absolutely - every icon can be replaced from PowerPoint's built-in library, and all colors are easily changed to match your branding requirements.
Will this work well for conversion funnel presentations?
Yes, the progressive structure is particularly effective for showing funnel stages from awareness to conversion with clear drop-off visualization.
Is the template compatible with Google Slides?
While optimized for PowerPoint, the template can be imported into Google Slides with minor formatting adjustments for most elements.