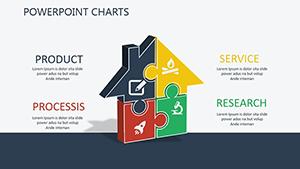
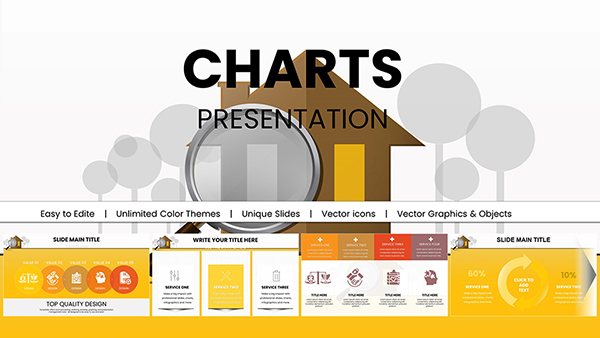
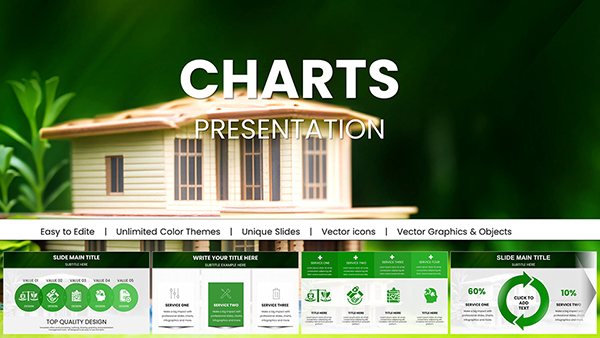
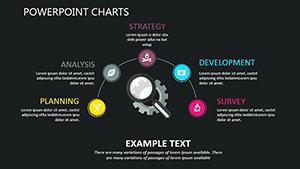
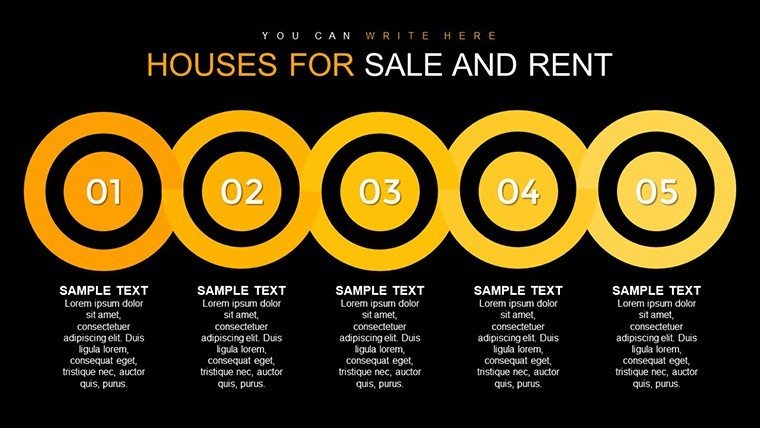
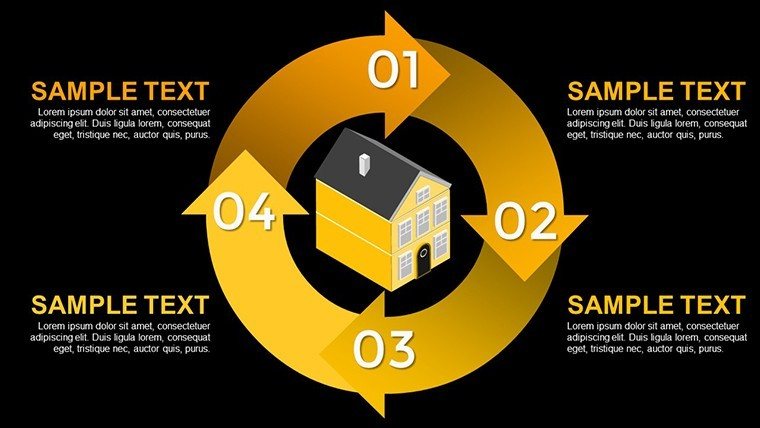
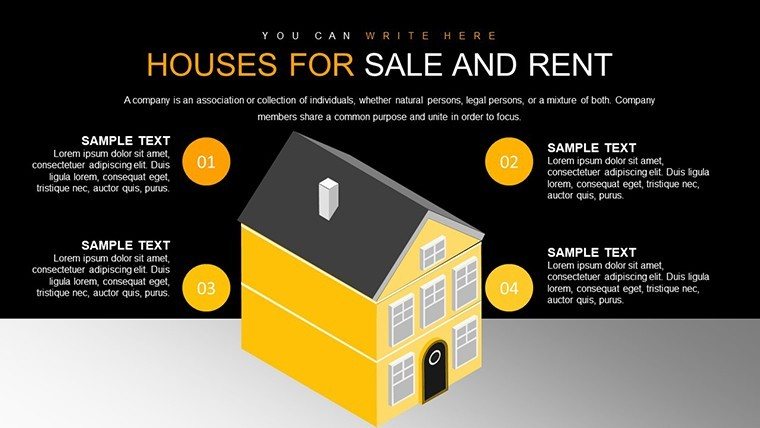
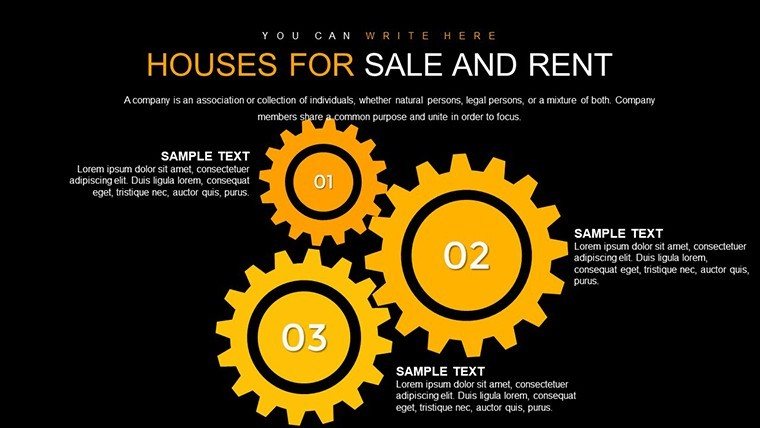
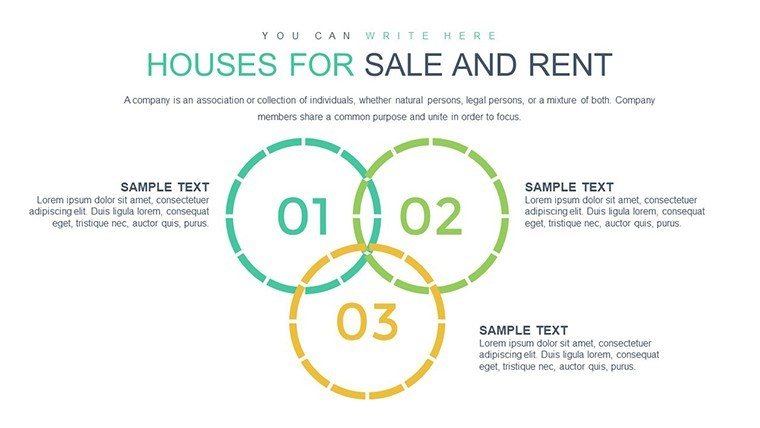
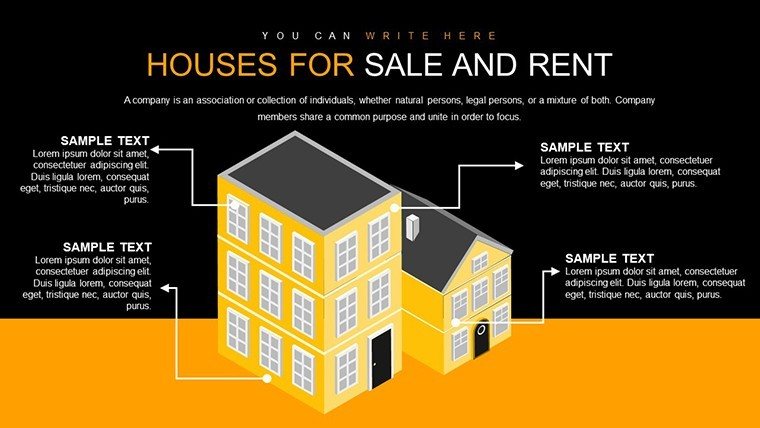
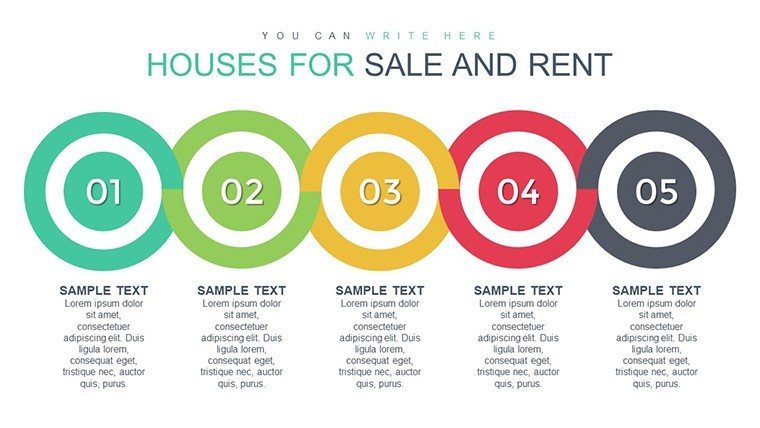
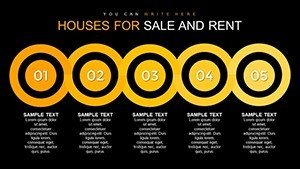
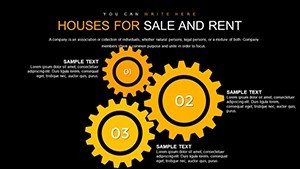
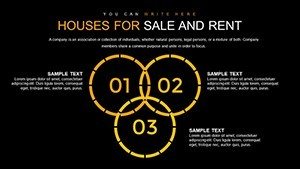
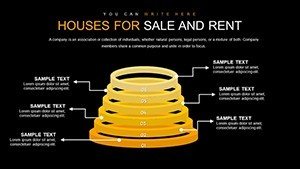
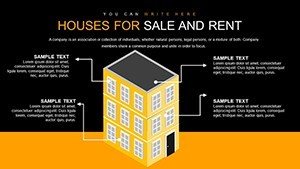
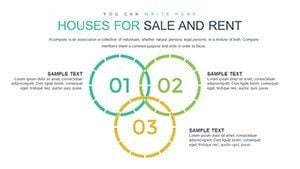
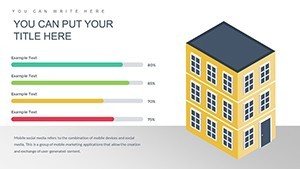
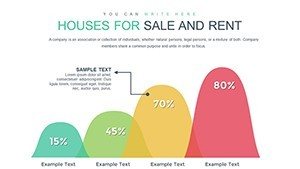
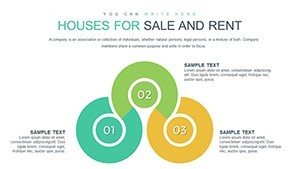
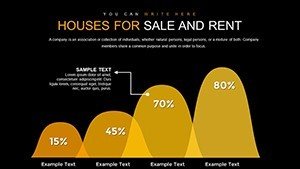
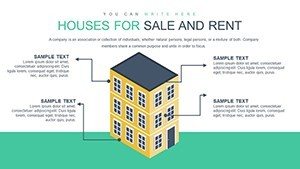
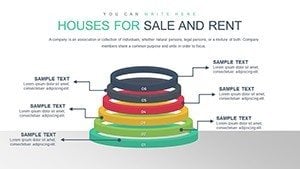
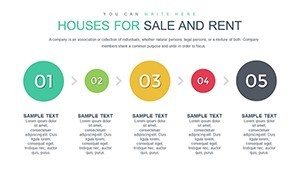
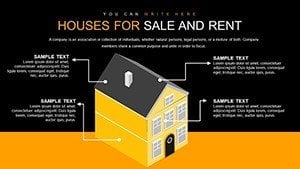
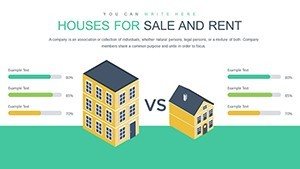
Houses for Sale and Rent PowerPoint Charts Template for Real Estate


Type: PowerPoint Charts template
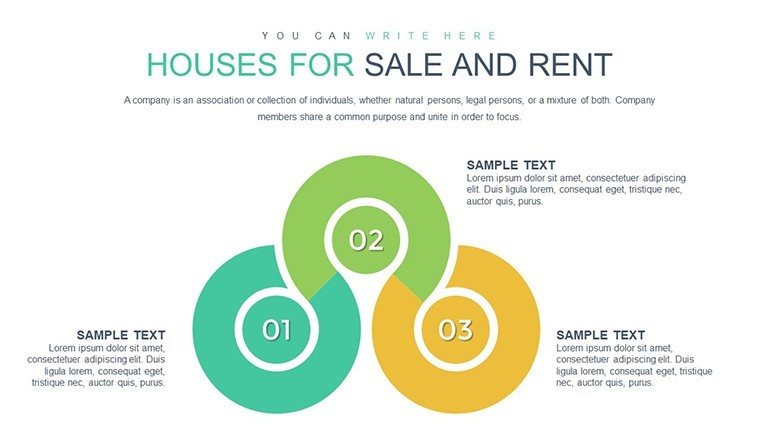
Category: Relationship, Illustrations
Sources Available: .pptx
Product ID: PC00753
Template incl.: 50 editable slides
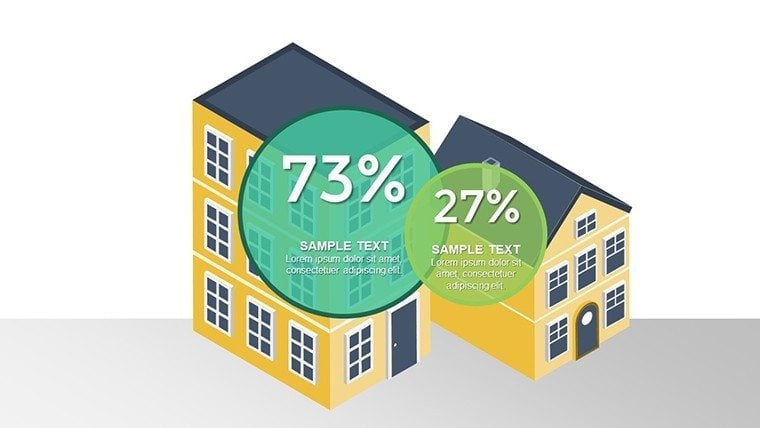
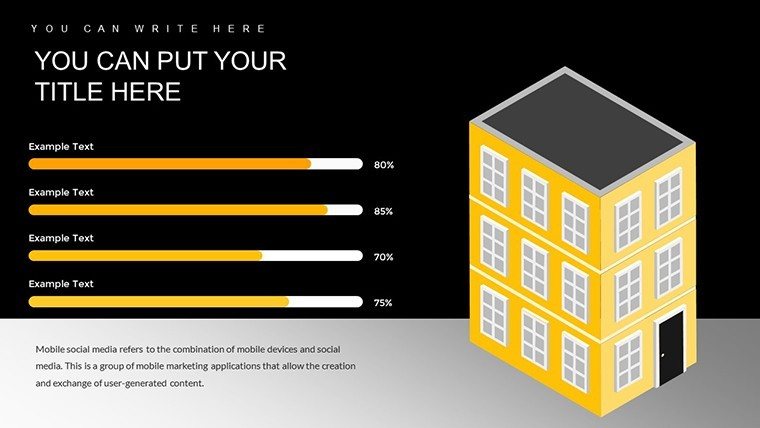
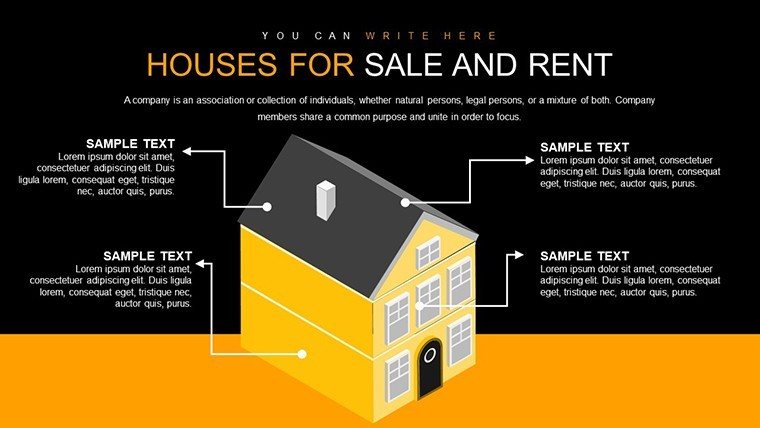
Navigating the competitive real estate market demands visuals that sell stories, not just stats. Our Houses for Sale and Rent PowerPoint Charts Template delivers with 50 editable slides, showcasing everything from cozy cottages to luxury estates through dynamic graphs on pricing, rentals, and values. Perfect for agents closing deals or investors analyzing trends, this template transforms data into persuasive narratives, inspired by Luxury Presence's winning sales presentations.
Compatible with PowerPoint, it offers customization to fit your brand, ensuring every pitch resonates. Align with NAR standards for market reporting, building trust and authority in your deliverables.
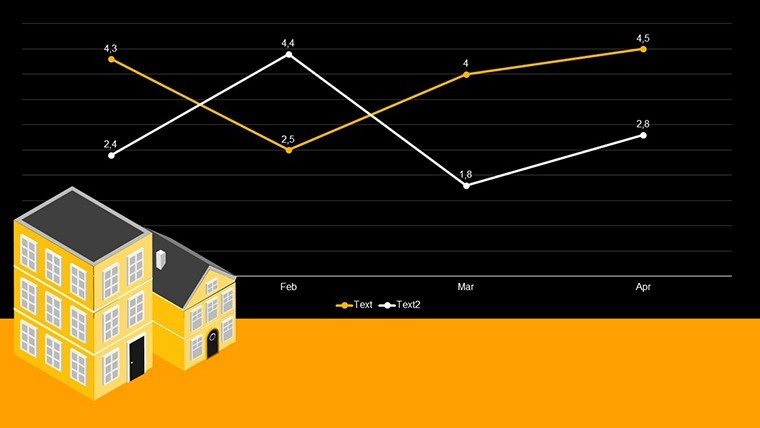
Capturing Real Estate Dynamics Visually
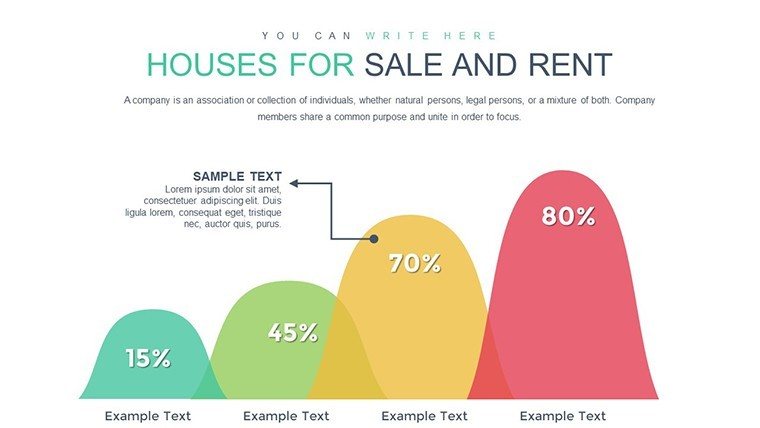
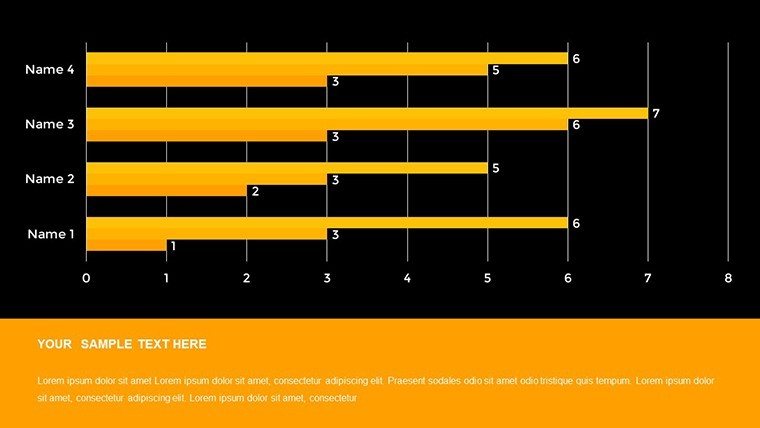
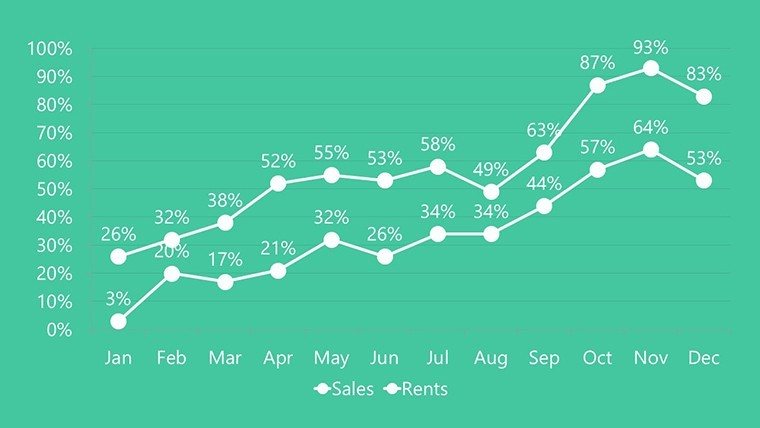
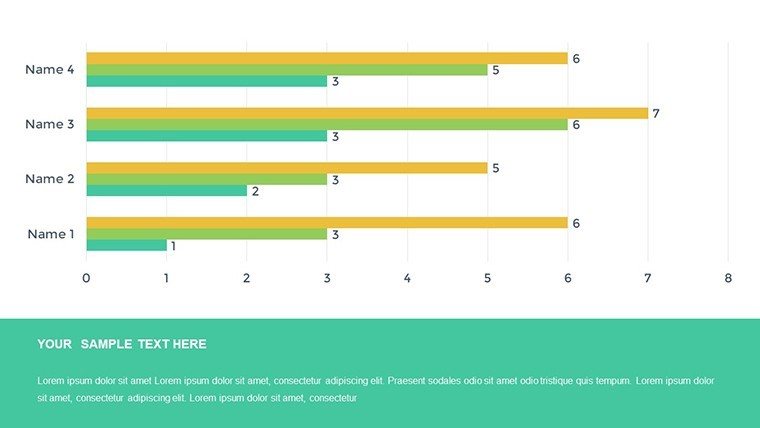
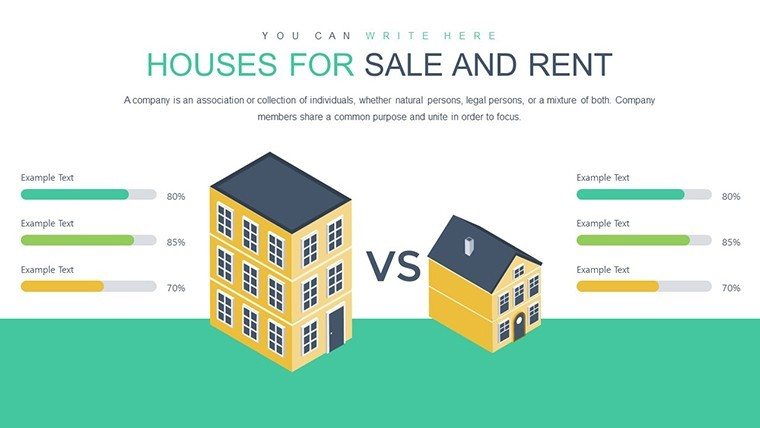
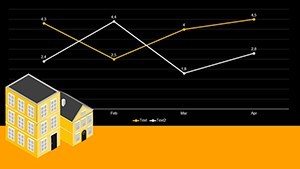
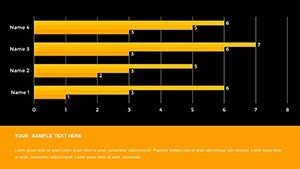
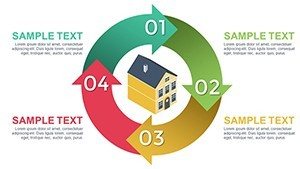
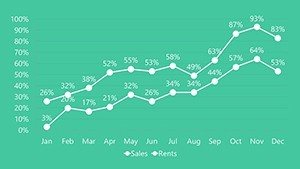
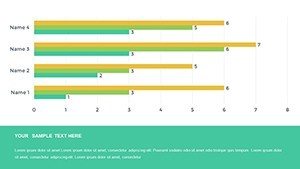
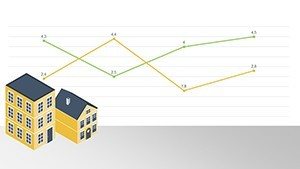
Real estate charts go beyond listings - they reveal market pulses. Use line graphs for price fluctuations or bar charts for rental comparisons, as in Local Housing Solutions' data visualizations that informed community policies.
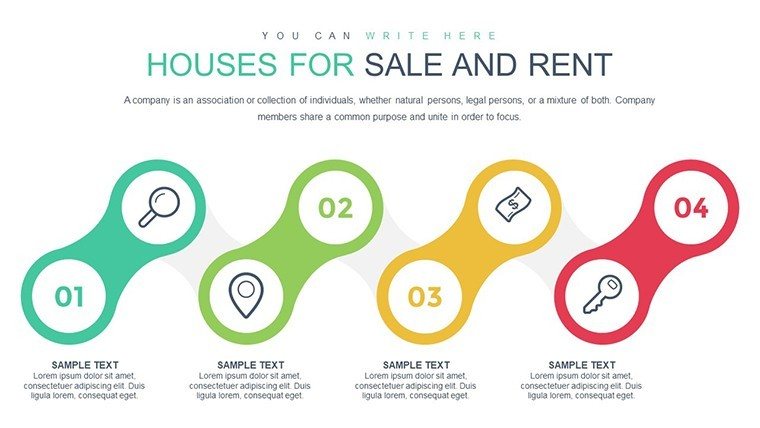
Core Features for Property Pros
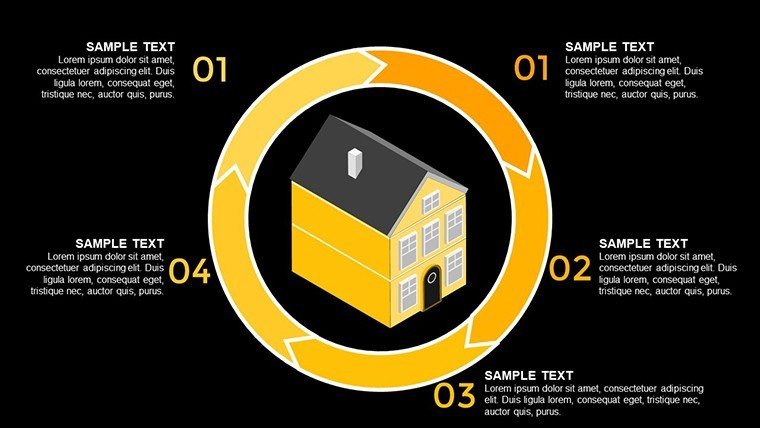
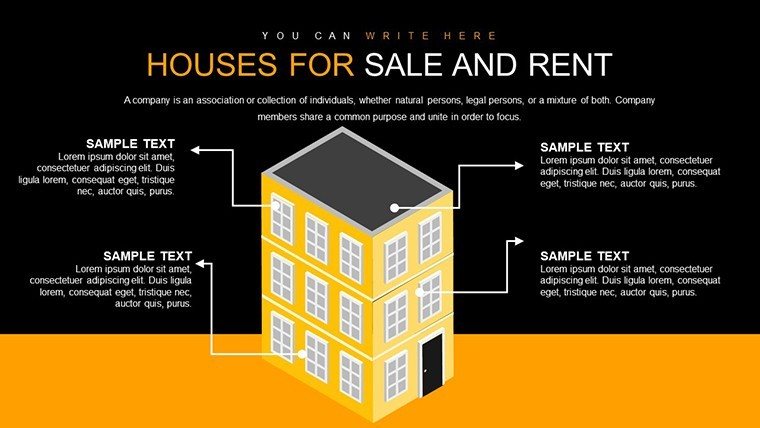
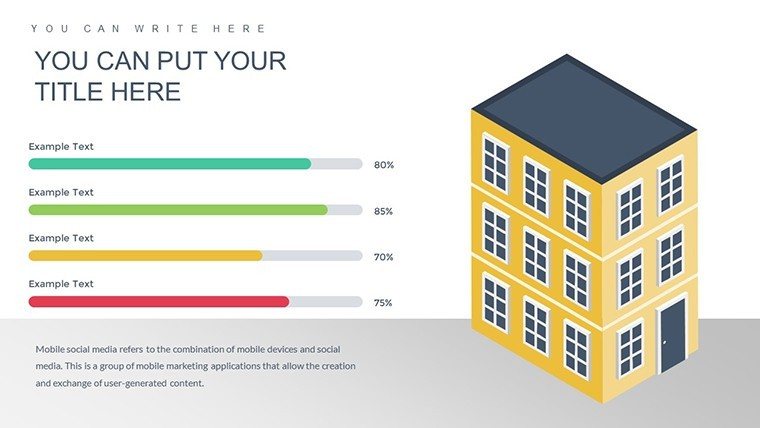
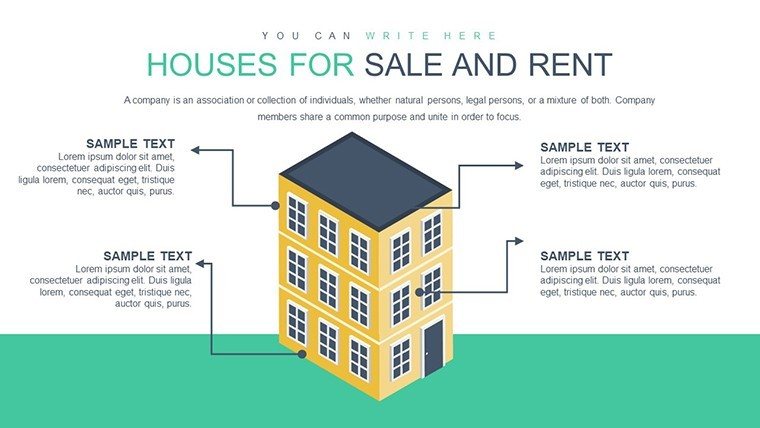
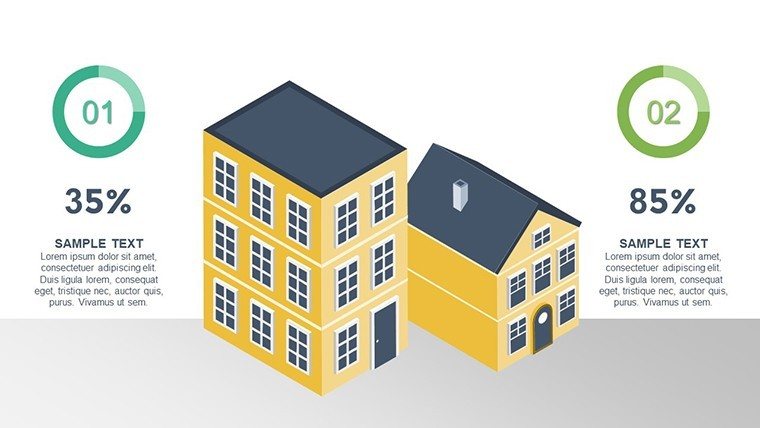
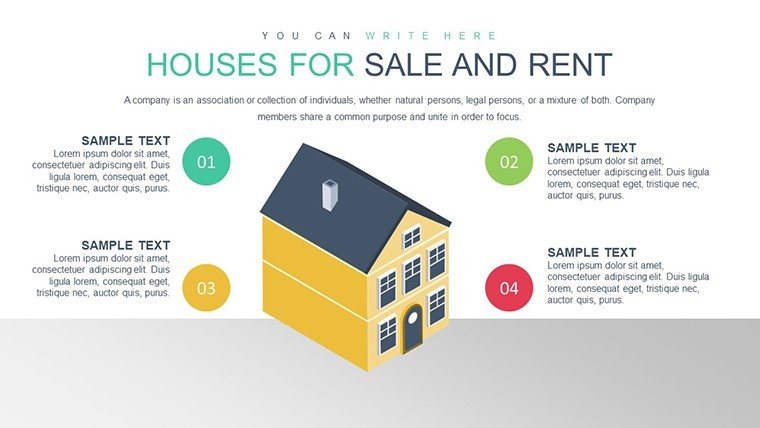
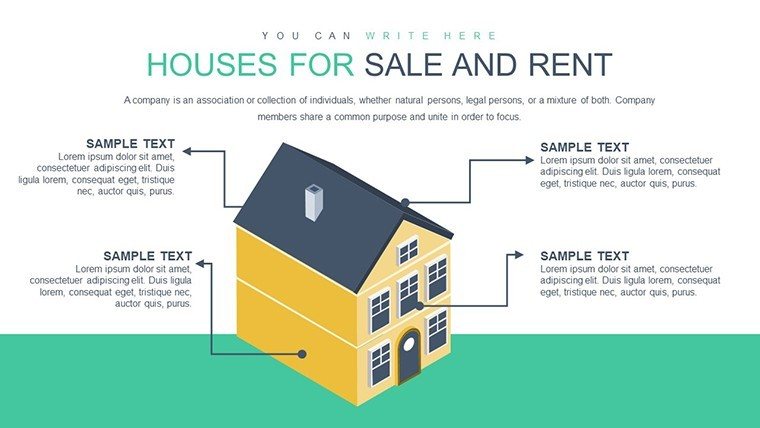
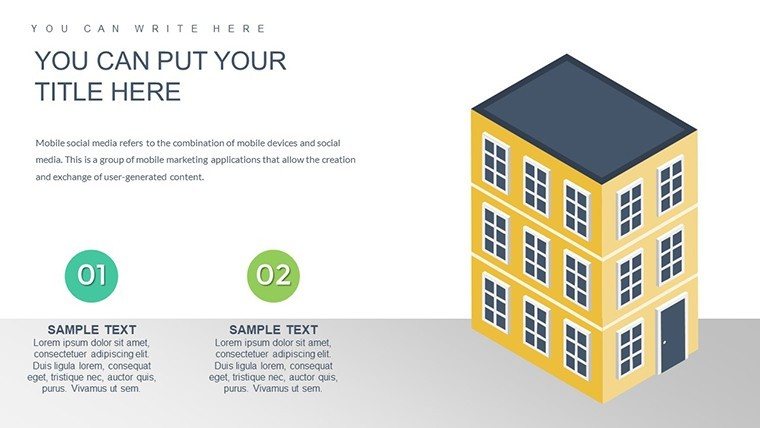
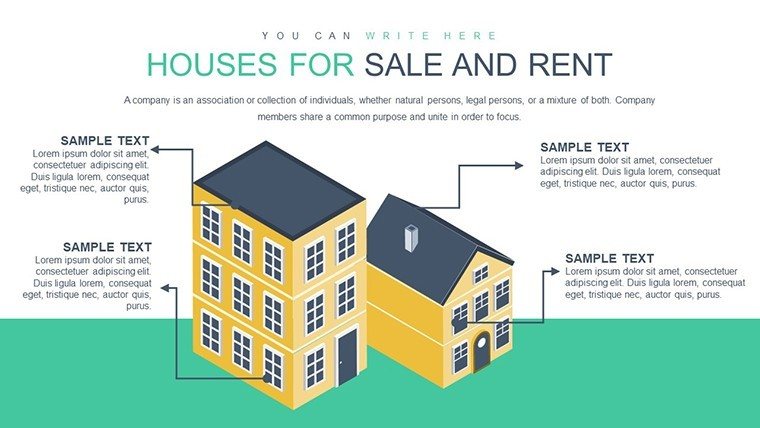
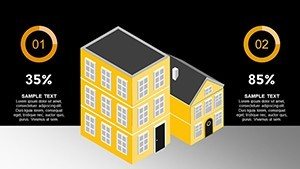
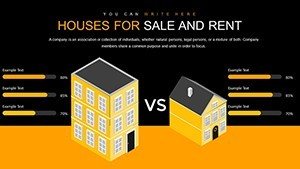
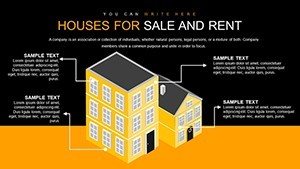
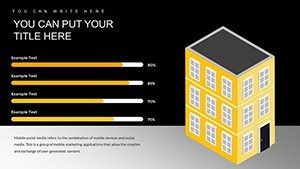
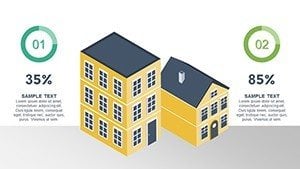
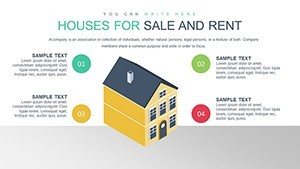
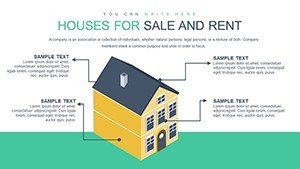
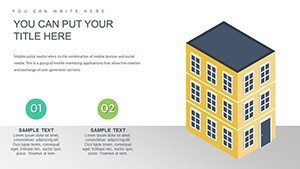
- Varied House Designs: Illustrations from modest homes to mansions.
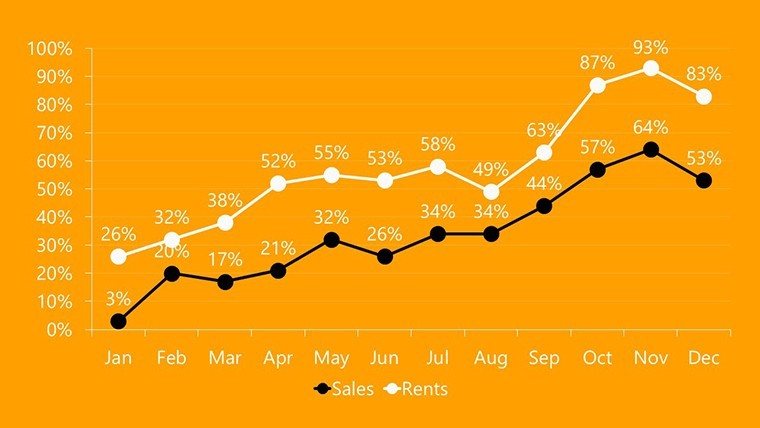
- Trend Charts: Pricing, rental rates, and value trackers.
- 50 Editable Slides: Ample for comprehensive decks.
- Customizable Graphics: Adapt to local markets.
- High-Quality Visuals: For print or digital use.
These elements echo SlideTeam's real estate case studies, where charts clinched deals by clarifying ROI.
Practical Use Cases in the Field
For listing presentations, map property values over time to justify pricing. Investors can analyze rent yields, similar to Romanpub's homebuyer behavior study using data viz for market insights. A success story: Storydoc's pitch decks helped agents secure high-end listings with interactive charts.
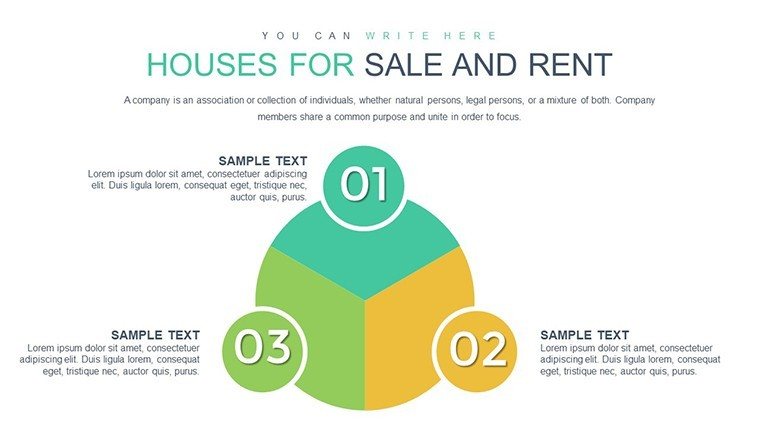
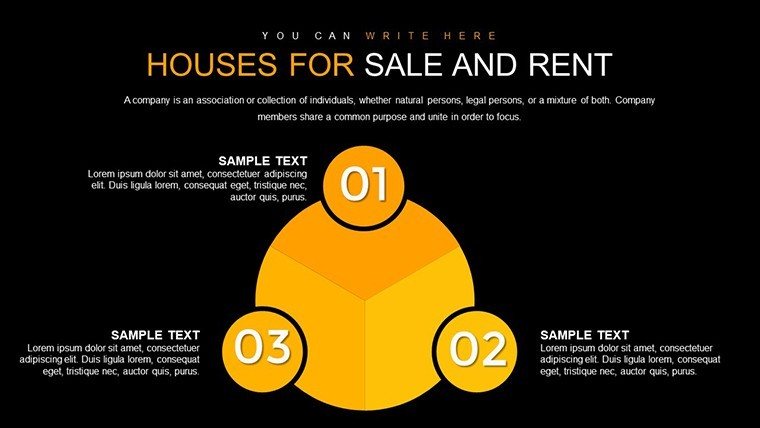
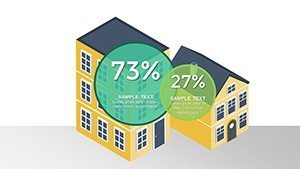
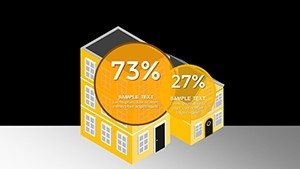
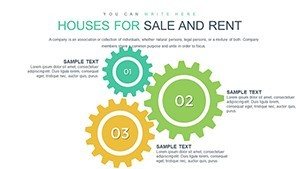
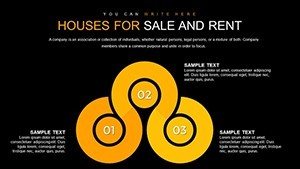
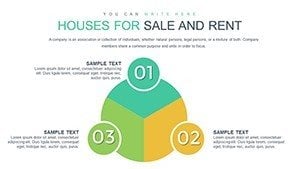
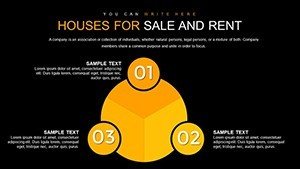
In client meetings, use pie charts for portfolio distributions, enhancing engagement as per Luxury Presence examples.
Building Your Presentation
- Choose slides based on audience (buyers vs. sellers).
- Input market data from MLS sources.
- Customize colors to evoke property vibes.
- Add photos or icons for realism.
- Rehearse for smooth delivery.
Sync with CRM tools for real-time updates.
Benefits Tailored to Real Estate Roles
Agents gain edge in comparables; managers track inventory. Outshines basic templates with niche charts like fluctuation timelines, saving design time.
From case studies, such visuals increased close rates by 15-20%.
Insider Tips for Stellar Pitches
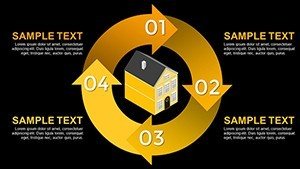
Layer maps with charts for geo-insights; use animations to reveal trends. Draw from Local Housing Solutions for community-focused narratives.
Optimize for SEO with alts like 'real estate pricing chart template'.
Secure Your Market Advantage
Elevate listings - download and dominate the real estate scene today.
FAQ
How many house types are illustrated?
Varied, from cottages to mansions for broad appeal.
Can I add my listings?
Yes, integrate photos and data easily.
Is it for sales or rentals only?
Both, with dedicated charts for each.
What data sources integrate?
Excel, MLS, or manual input.
Are updates free?
Yes, lifetime access to improvements.