6-Level 3D Block Pyramid PowerPoint Charts: Visualize Hierarchies with Depth


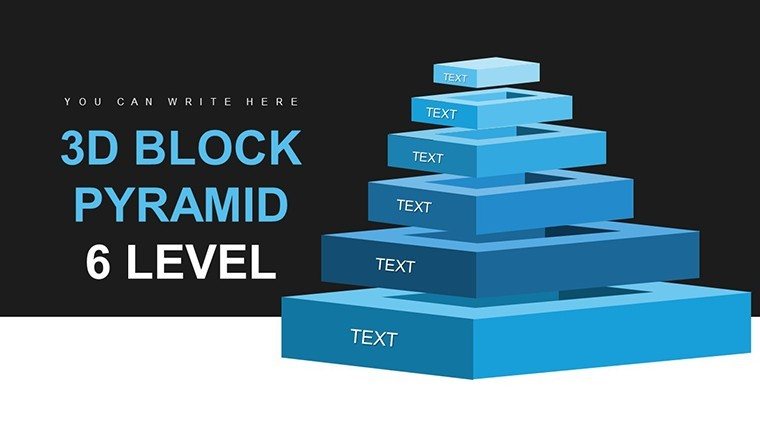


In the fast-paced world of architecture and business strategy, conveying complex hierarchies demands more than flat diagrams - it requires visuals that pop with dimension and clarity. Enter our 6-Level 3D Block Pyramid PowerPoint Charts Presentation, a meticulously crafted tool designed to turn abstract data into tangible, engaging stories. Whether you're an architect outlining multi-phase building projects or a consultant mapping organizational growth, this template bridges the gap between raw information and audience insight. With 32 fully editable slides, you'll harness the power of 3D design to showcase levels of progression, from foundational concepts to pinnacle achievements. Imagine presenting a skyscraper development plan where each block represents a construction milestone, drawing stakeholders in with vivid, layered visuals that make your narrative unforgettable. This isn't just a template; it's your secret weapon for presentations that resonate and inspire action.
Unlock the Power of 3D Visualization in Your Slides
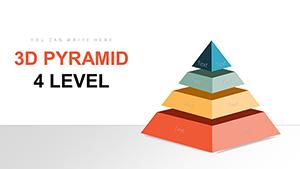
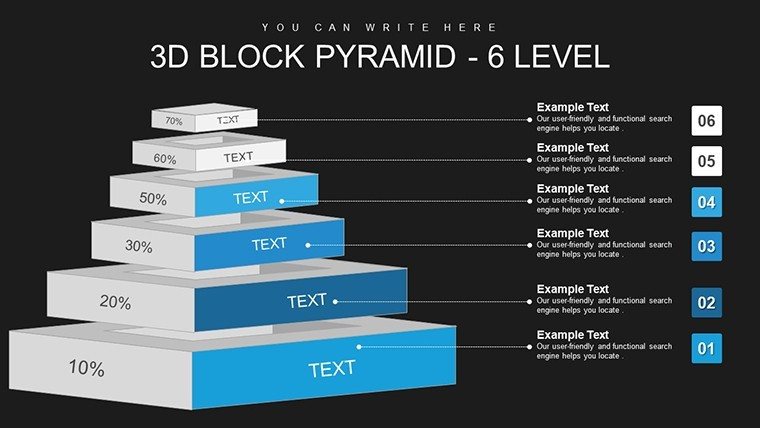
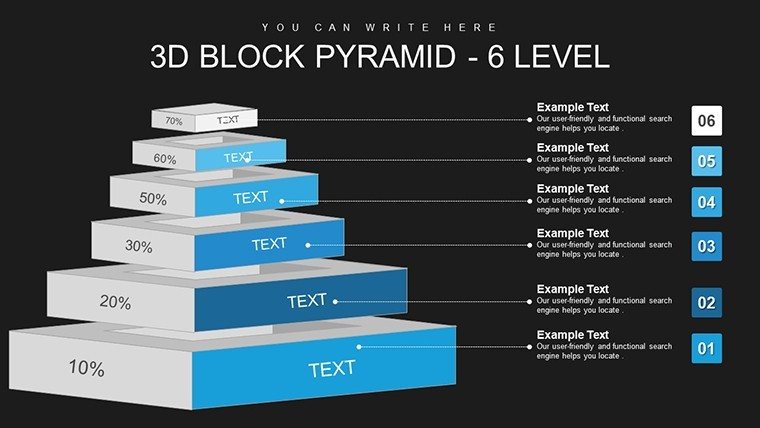
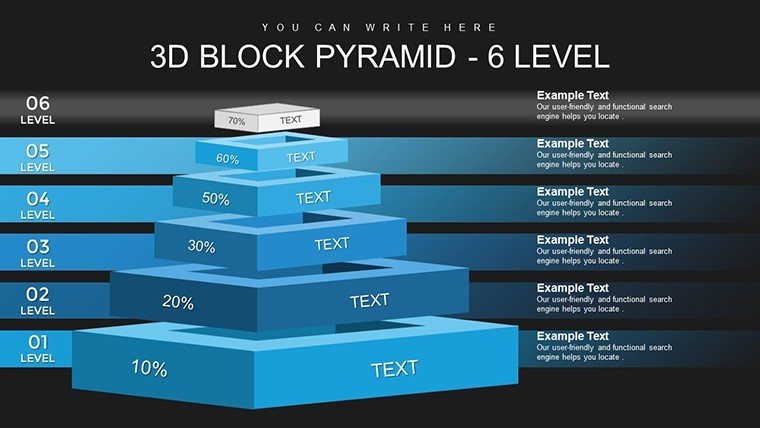
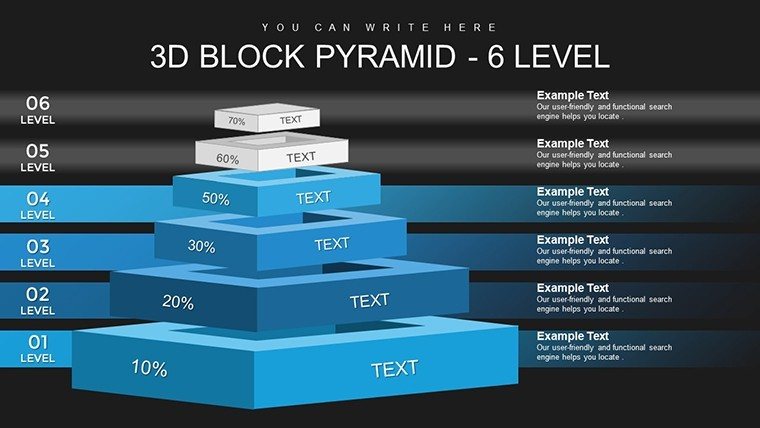
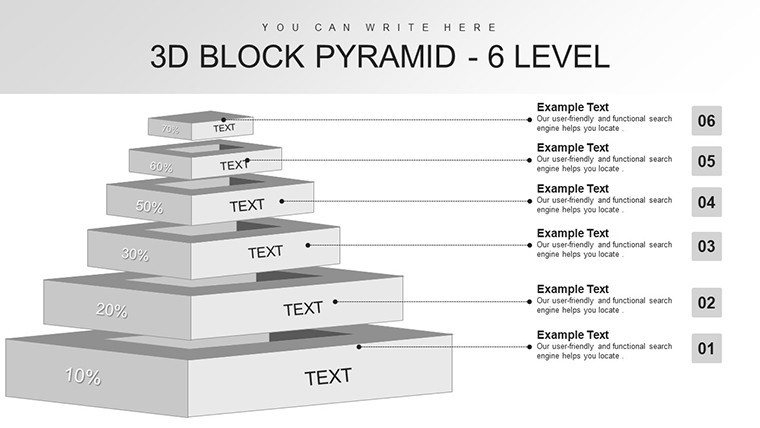
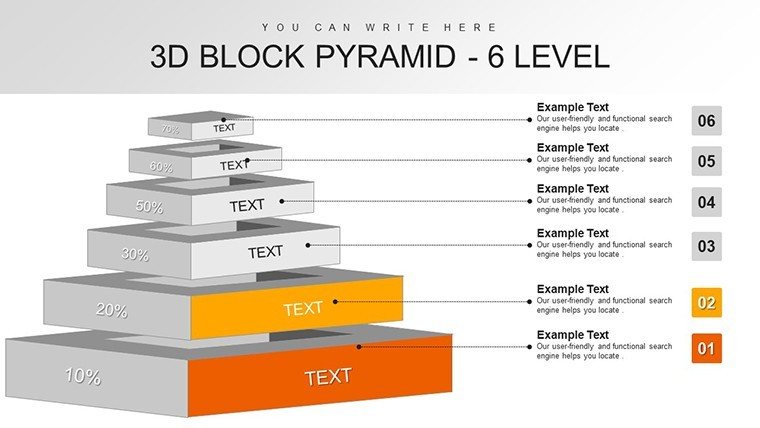
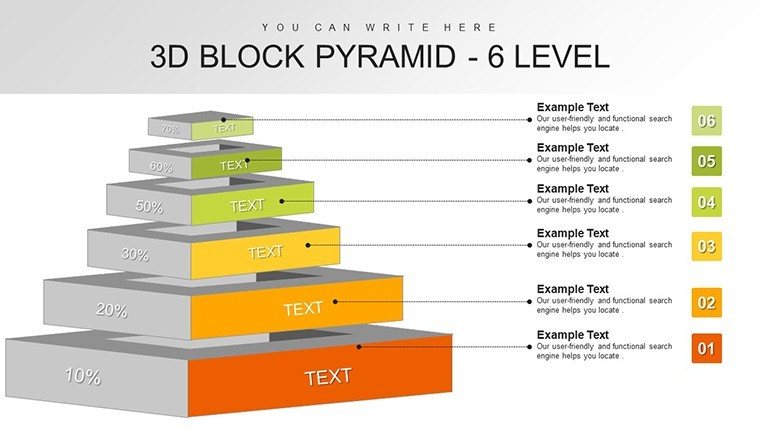
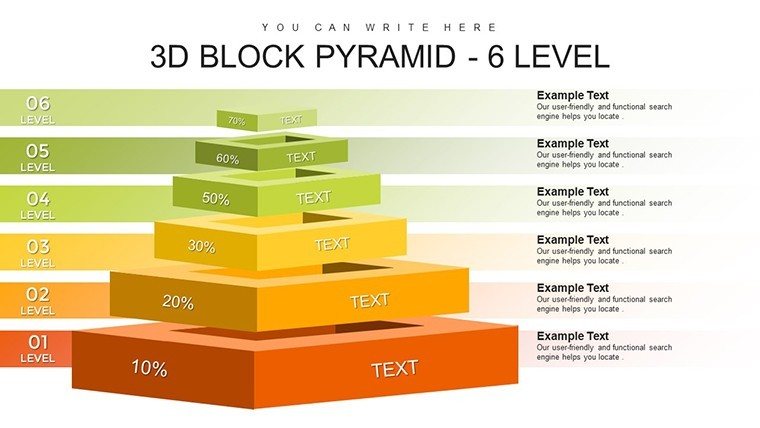
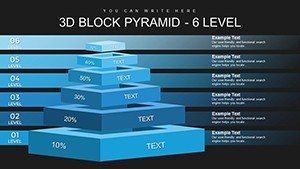
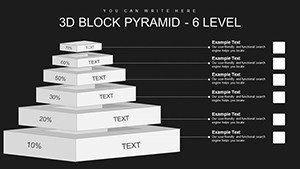
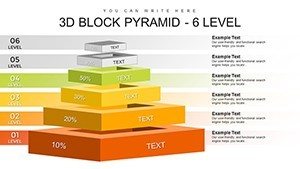
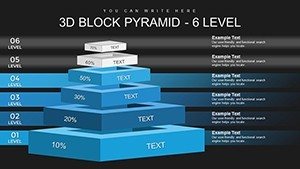
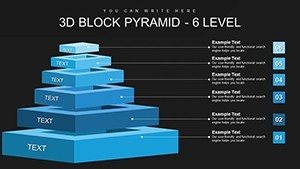
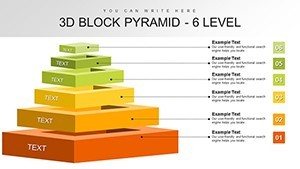
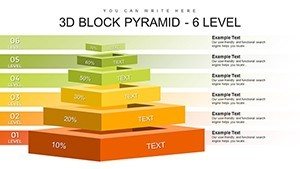
Traditional 2D charts often fall flat when depicting intricate structures, but our 6-level pyramid introduces depth that mirrors real-world architecture. Each block is rendered in high-fidelity 3D, allowing shadows and perspectives to emphasize hierarchy without overwhelming the viewer. Architects can use this to illustrate zoning layers in urban planning, where the base level might detail site analysis, ascending to regulatory approvals at the top. The template's intuitive drag-and-drop interface means you spend less time fiddling with tools and more on refining your message. Compatible with PowerPoint 2016 and beyond, including Microsoft 365, it ensures seamless integration into your workflow. Plus, with diverse color palettes - from earthy tones for sustainable designs to bold hues for innovative pitches - you can align every element with your brand's aesthetic.
Detailed Slide Breakdown: From Foundation to Summit
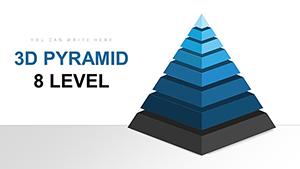
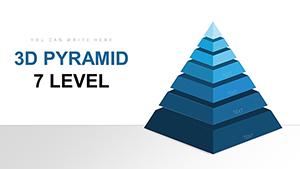
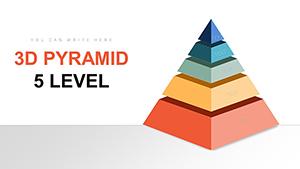
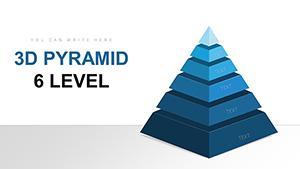
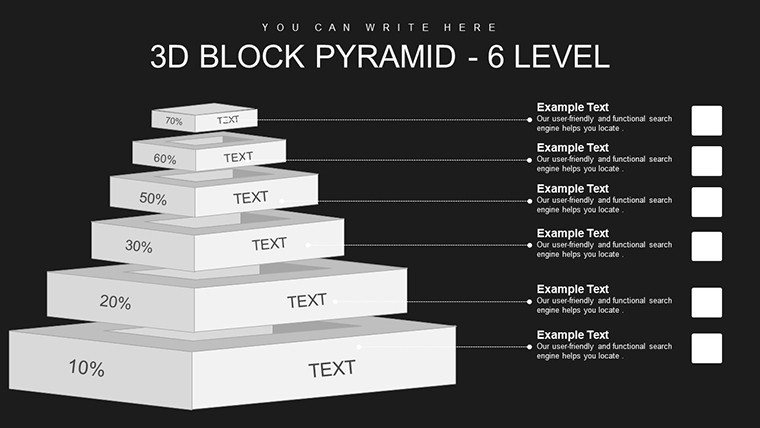
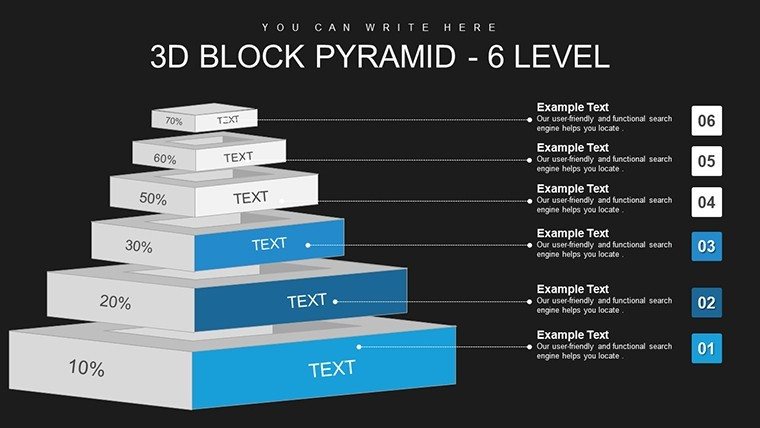
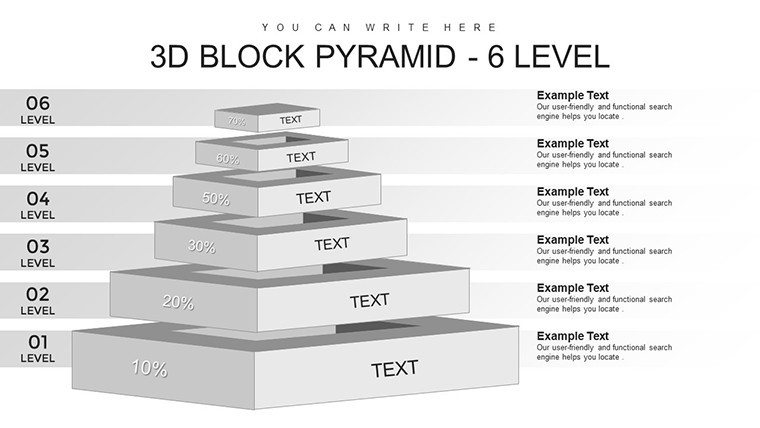
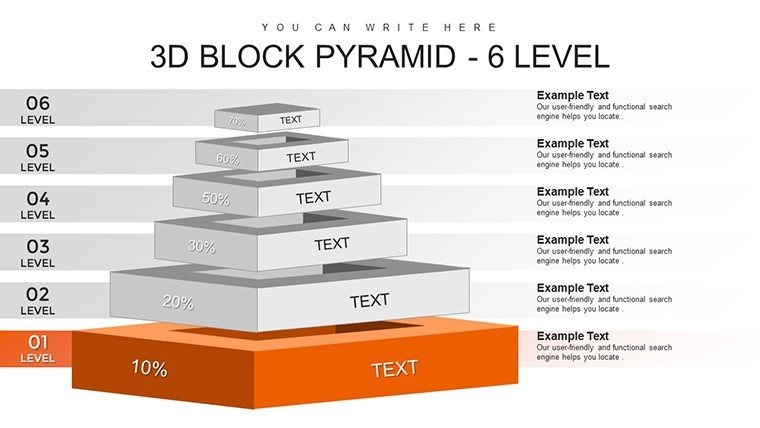
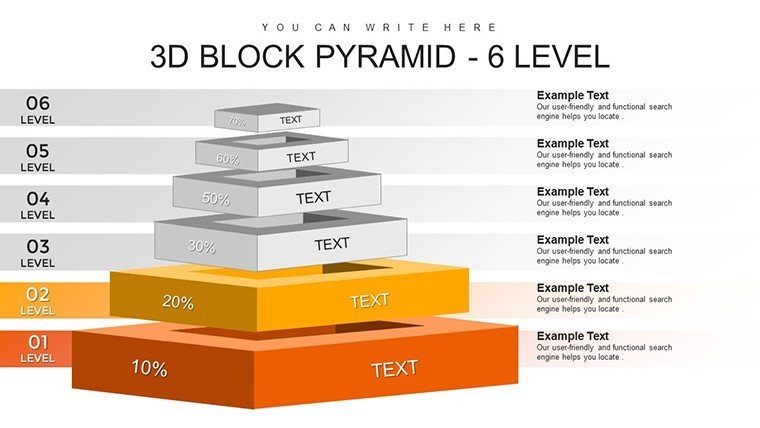
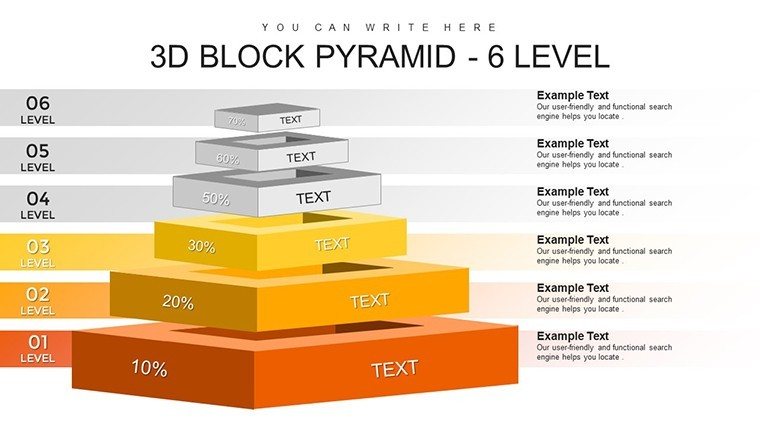
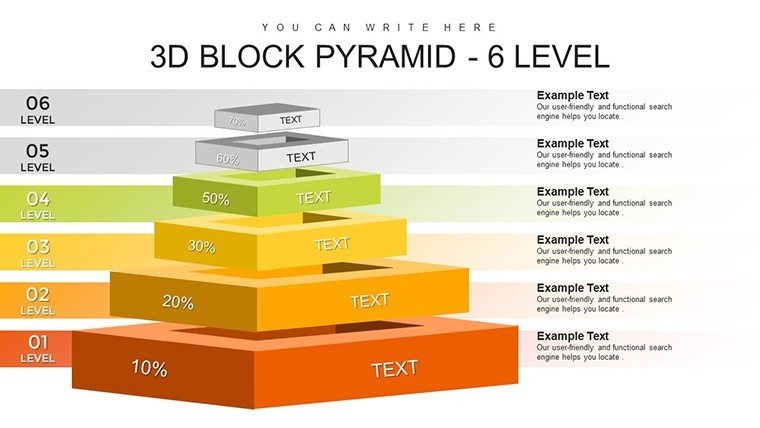
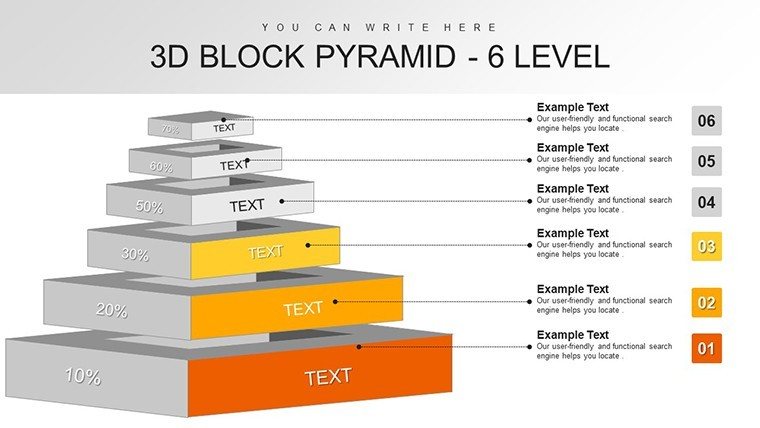
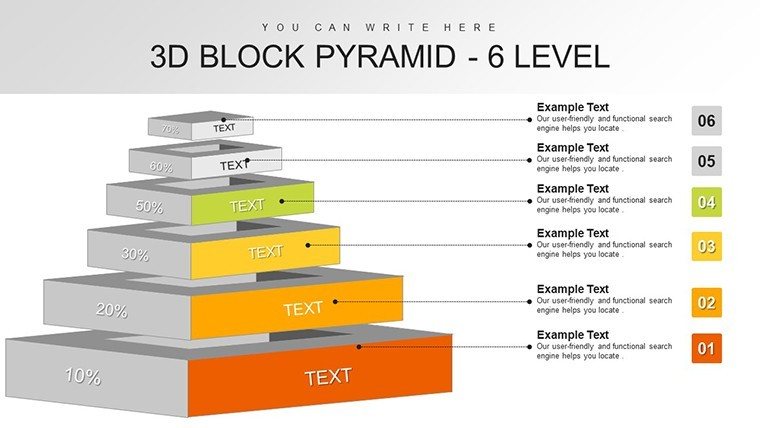
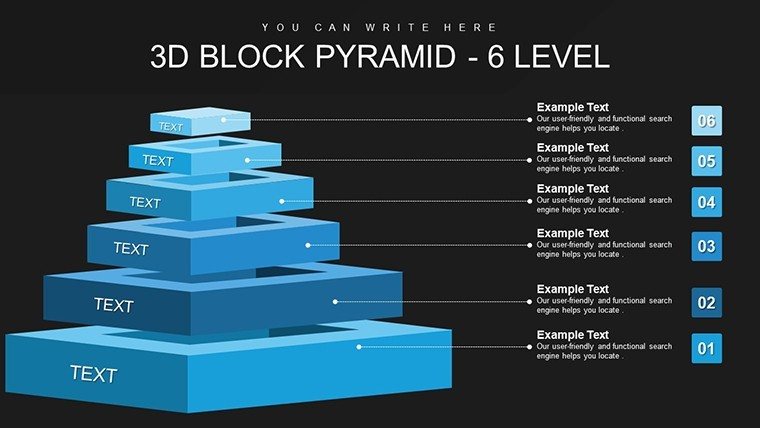
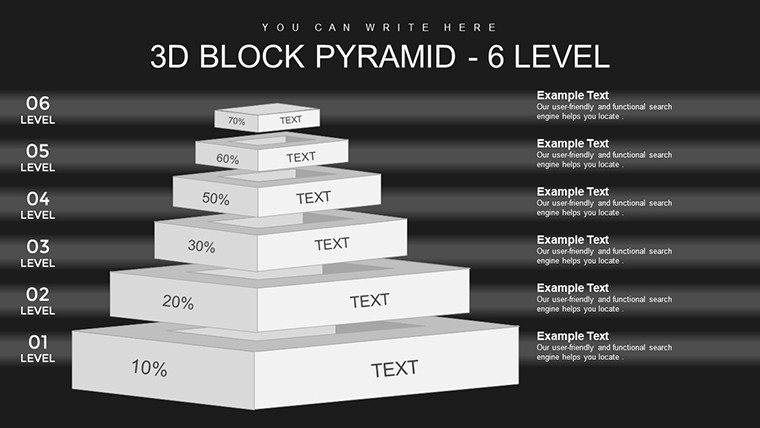
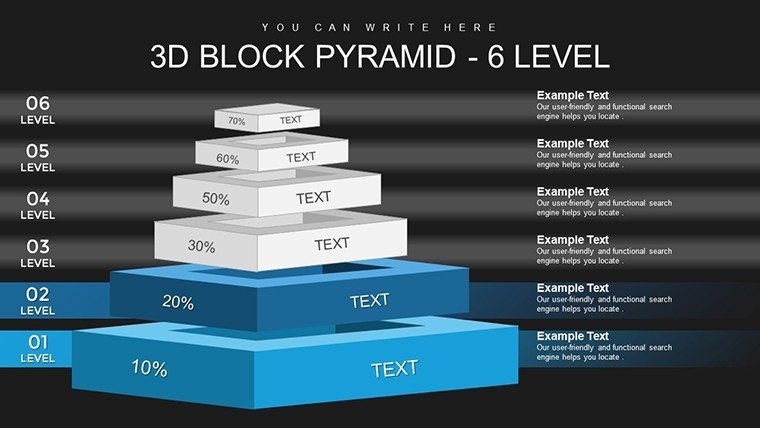
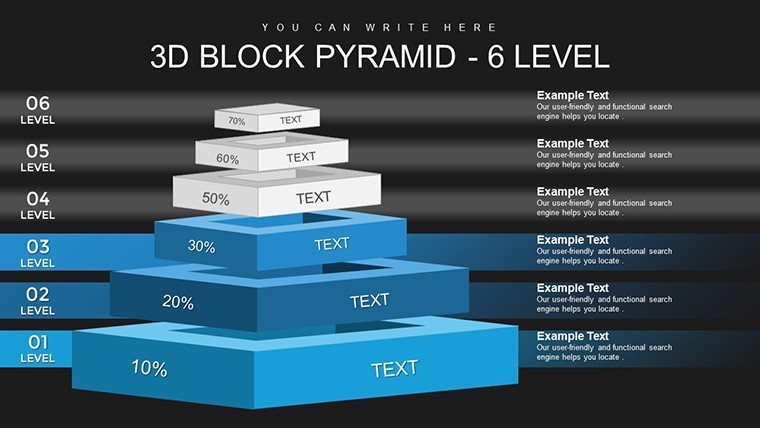
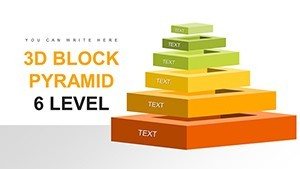
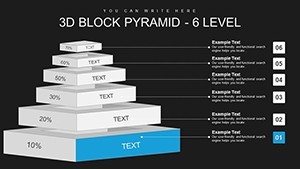
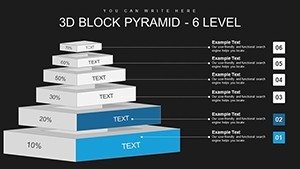
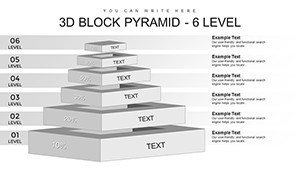
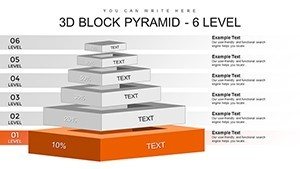
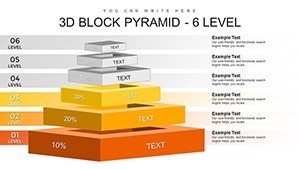
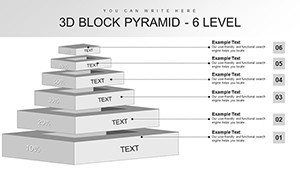
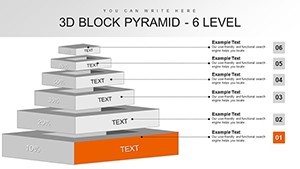
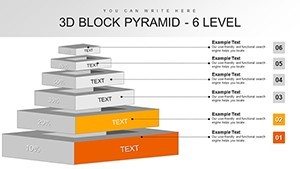
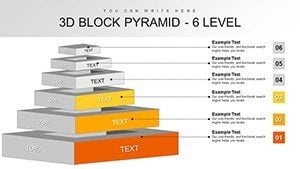
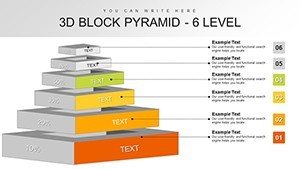
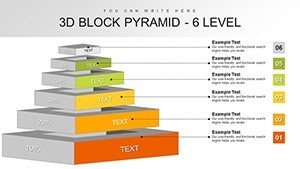
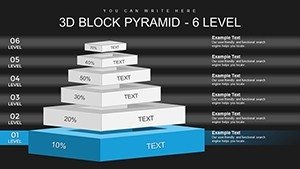
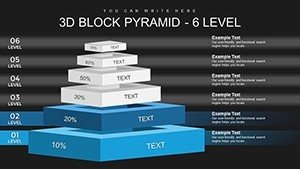
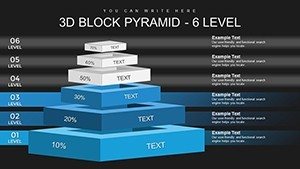
Dive into the 32 slides, each optimized for specific storytelling needs. Slides 1-5 introduce the pyramid basics: a clean, unlabeled 3D structure ready for your data, followed by variants with numbered levels for quick annotations. For instance, in an architectural context, use Slide 3 to map out a project's lifecycle - level 1 for conceptual sketches, level 2 for blueprints, up to level 6 for post-construction evaluation. Slides 6-15 offer themed variations, incorporating icons like blueprints or hard hats to add relevance. These are perfect for AIA-compliant presentations, where clarity on project phases can make or break funding approvals. Mid-section slides (16-25) include data integration tools, such as embedded charts for cost breakdowns or timeline overlays, ensuring your pyramid isn't just pretty - it's practical. Finally, slides 26-32 provide summary views and call-to-action prompts, ideal for wrapping up with a strong visual recap.
- Customizable Elements: Adjust block sizes, colors, and labels to fit unique project scales, like scaling up for mega-structures.
- Icon Library: Over 50 architecture-specific icons, from beams to eco-friendly symbols, enhancing thematic depth.
- Animation Options: Built-in transitions that build the pyramid level by level, keeping audiences engaged during reveals.
Real-World Applications: Elevating Architectural and Business Pitches
Picture this: You're pitching a sustainable housing complex to investors. Instead of dense text slides, deploy our 6-level pyramid to layer your proposal - base for environmental impact studies, mid-levels for design innovations, and the apex for ROI projections. This approach not only aligns with AIA standards for clear communication but has been shown in case studies from firms like Gensler to boost stakeholder buy-in by up to 30%. For educators in design schools, it simplifies teaching hierarchical principles, such as Maslow's needs adapted to building ergonomics. Consultants benefit too, using it to dissect client operations, revealing bottlenecks in workflows. In one real-world example, a urban planning team used a similar 3D model to secure city council approval for a mixed-use development, crediting the visual aid for demystifying complex zoning hierarchies.
Beyond architecture, business leaders can adapt it for strategy sessions. Map out a six-stage growth plan, with each block highlighting key metrics like market entry at the base and global expansion at the top. The template's versatility shines in hybrid uses, such as combining with Google Slides for collaborative edits during remote team huddles. And for those wary of compatibility issues, rest assured - it's tested across versions, ensuring your pyramid stands tall on any device.
Expert Tips for Maximum Impact
- Start with your core message: Identify the six key layers before populating the pyramid to maintain focus.
- Incorporate data wisely: Use embedded Excel links for dynamic updates, ideal for fluctuating project budgets.
- Balance visuals: Avoid clutter by limiting text per level - aim for 5-7 words to let the 3D design speak.
- Test animations: Preview in slideshow mode to ensure smooth builds, enhancing narrative flow.
- Seek feedback: Share drafts with colleagues to refine, much like iterative architectural designs.
These tips, drawn from years of presentation expertise, help you avoid common pitfalls, like overcomplicating visuals, ensuring your audience walks away informed and inspired.
Why This Template Outshines Basic PowerPoint Tools
Built-in PowerPoint shapes are functional but lack the polish of our pre-designed 3D blocks. Our template offers superior rendering, with anti-aliasing for crisp edges and gradient fills that add realism, mimicking actual building materials. Unlike generic options, it includes architecture-tuned elements, such as scalable grids for proportion accuracy. Users report saving hours per presentation, freeing time for creative ideation. In a competitive field where first impressions count, this tool positions you as a forward-thinking professional, ready to tackle challenges from LEED certifications to client consultations.
As you integrate this into your toolkit, consider how it fosters better collaboration. Share editable files with teams, allowing real-time inputs on project hierarchies. For trustworthiness, all elements are vector-based, scaling without loss of quality - essential for high-res prints in proposal packets.
Ready to build presentations that stand the test of time? Customize this 6-level masterpiece and watch your ideas ascend.
FAQ
How editable are the 3D blocks in this pyramid template?
Every element is fully editable - resize, recolor, or reposition blocks, text, and icons directly in PowerPoint for a tailored fit.
Can I use this template for non-architectural presentations?
Absolutely; it's versatile for any hierarchical data, from business strategies to educational modules, with easy adaptations.
What PowerPoint versions are supported?
Compatible with PowerPoint 2016 and later, including Microsoft 365, ensuring broad accessibility.
Are there animation features included?
Yes, pre-set animations build the pyramid level by level, adding dynamism to your storytelling.
How does this compare to free alternatives?
Unlike free tools, it offers high-fidelity 3D designs, themed icons, and professional layouts for superior results.
Can I integrate data from Excel?
Certainly; link charts to Excel for automatic updates, perfect for data-driven architectural pitches.