 Click to zoom
Fully Editable 4-Segment Data Comparison PowerPoint Template - Instant Download
| Format | .pptx |
| Slides | 26 unique layouts |
| Aspect ratio | 16:9 |
| Compatibility | PowerPoint |
| Animated | No |
| Language | English |
| License | Commercial |
| File size | — |
| Version | v1.0 |
| Last updated | February 2026 |
What's inside
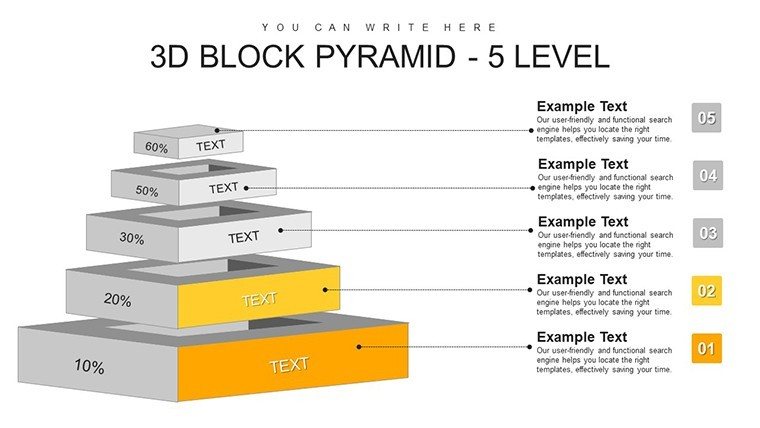
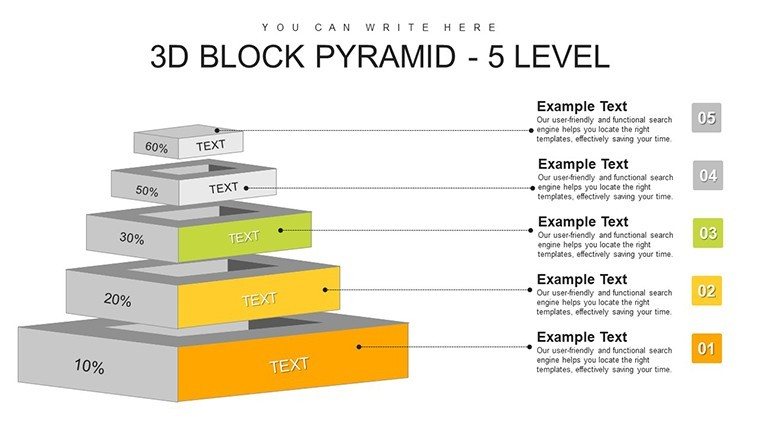
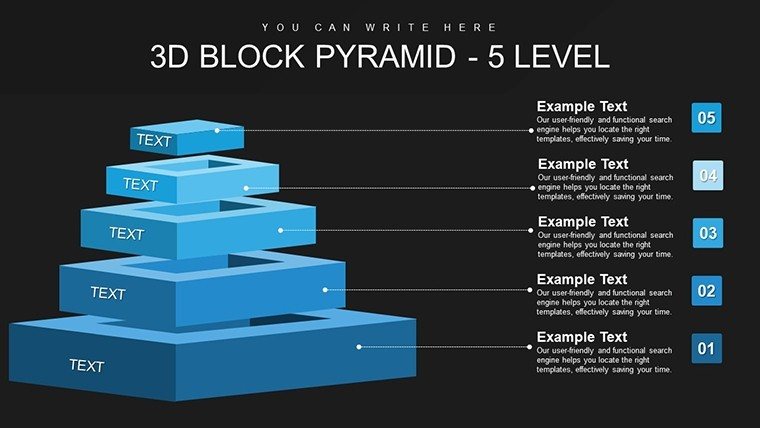
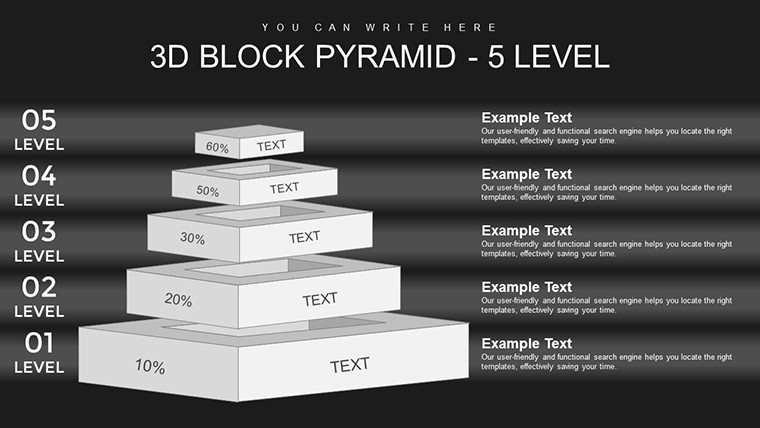
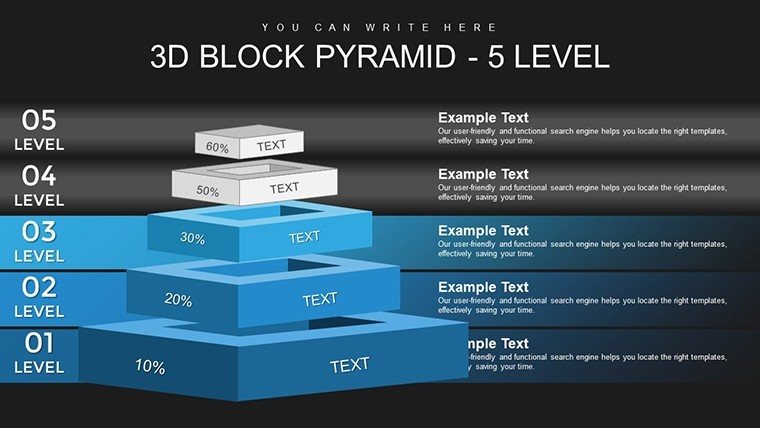
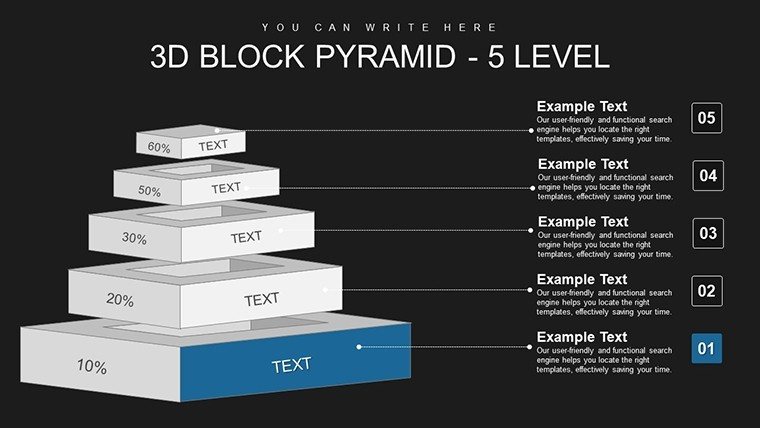
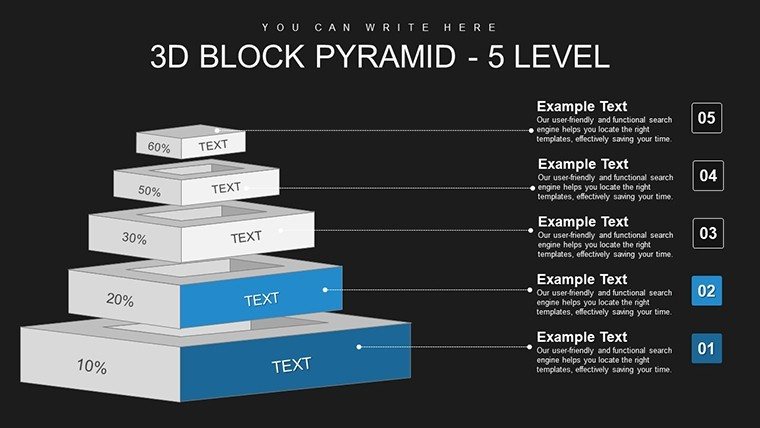
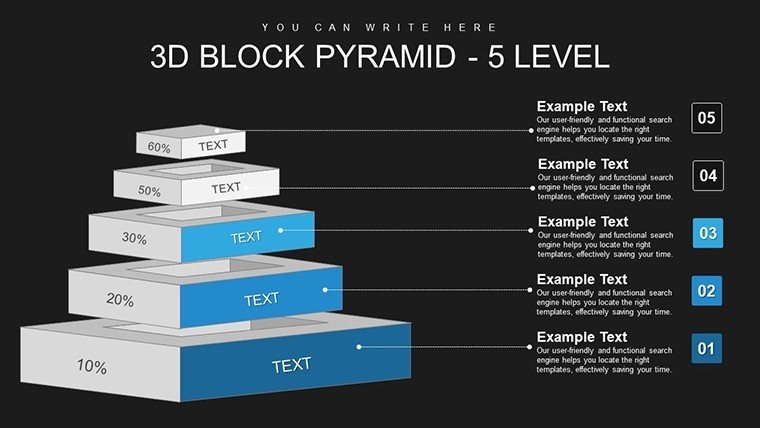
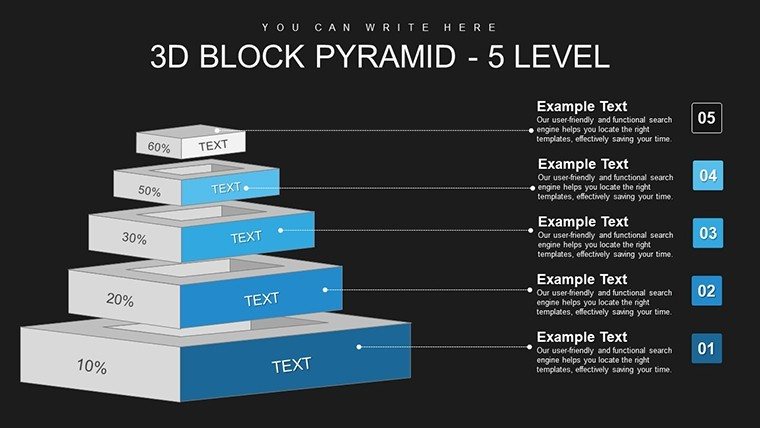
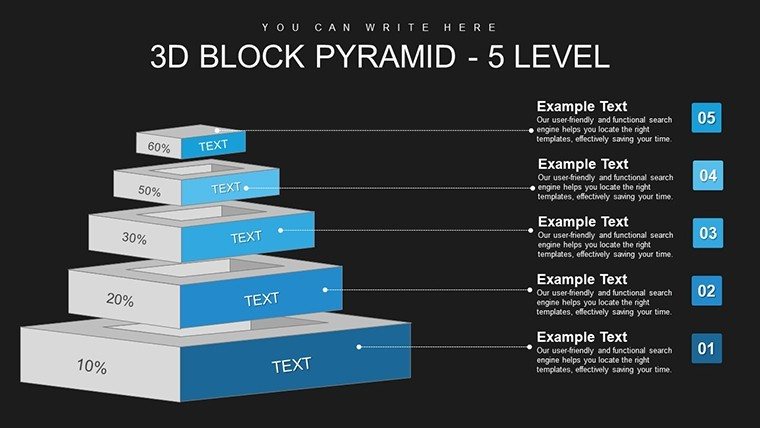
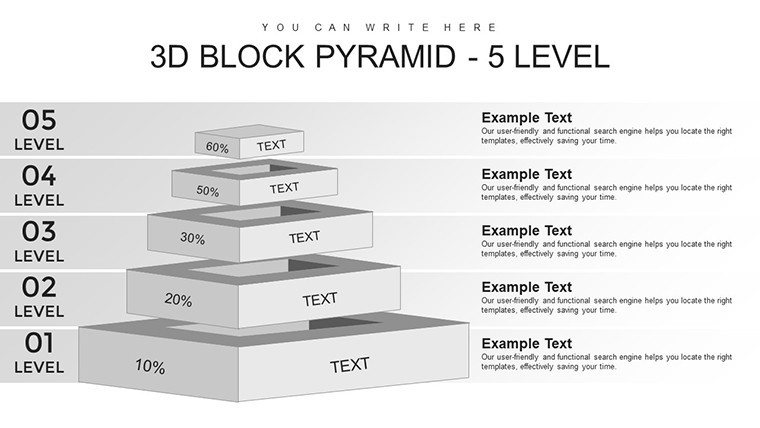
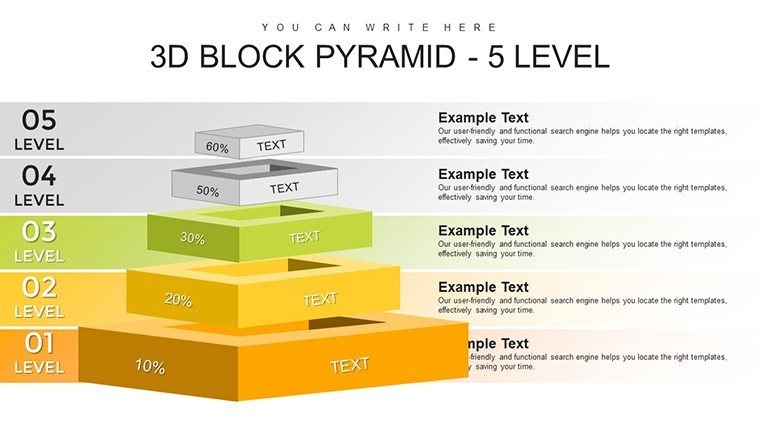
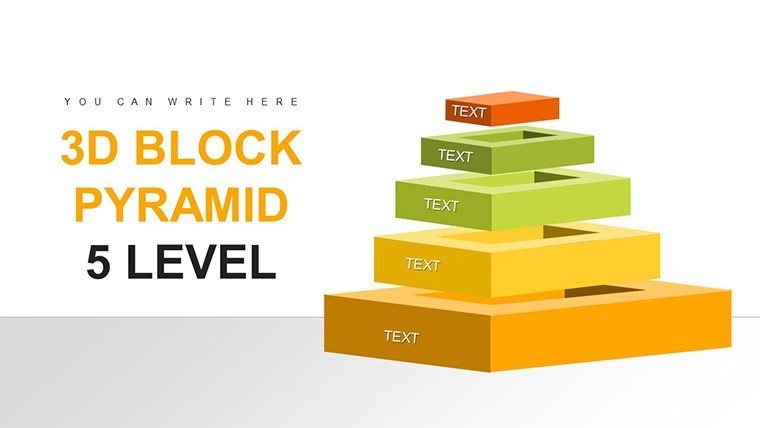
When presenting performance metrics across four distinct categories - such as departments, regions, competitors, or product lines - a structured visual layout is essential for clear analysis and decision-making. This 4-segment data comparison PowerPoint template delivers a balanced, high-impact design that places each variable on equal footing for immediate visual benchmarking. Ideal for consultants and managers, it transforms raw data into compelling insights that drive strategic discussions.
Key Features
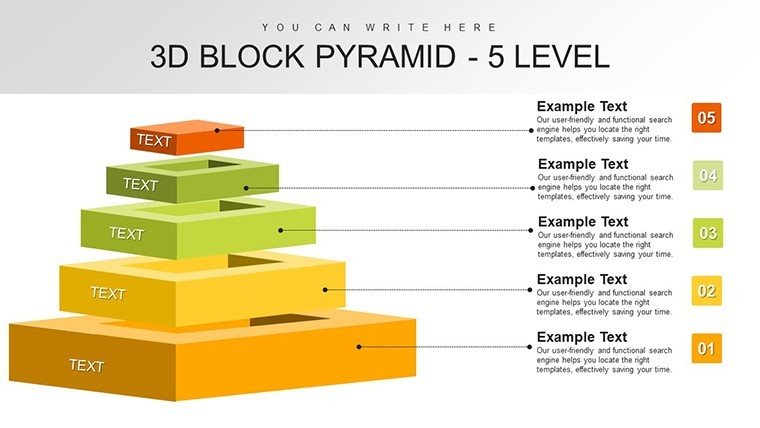
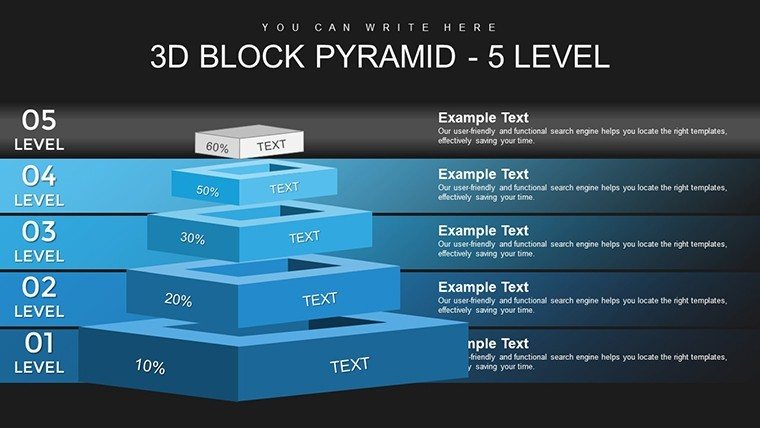
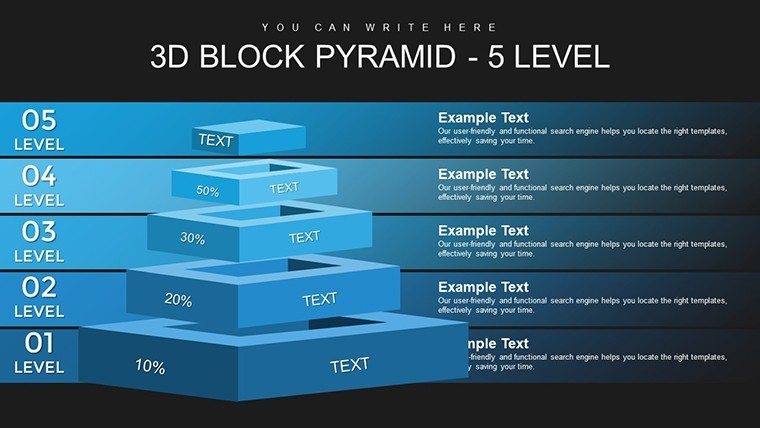
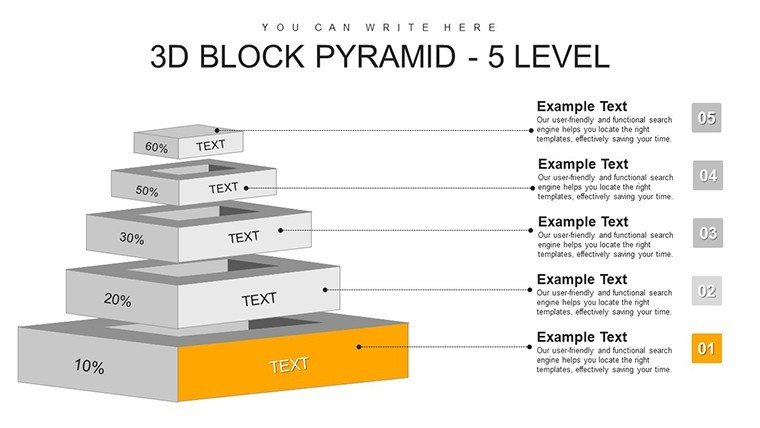
- Four clearly defined segments with optimized spacing and boundaries
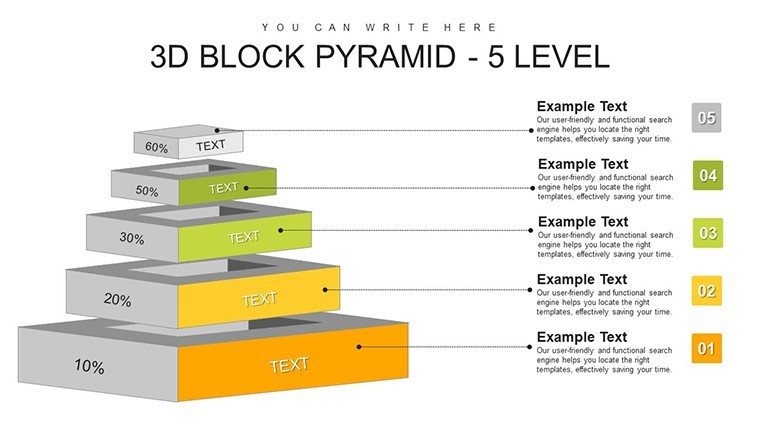
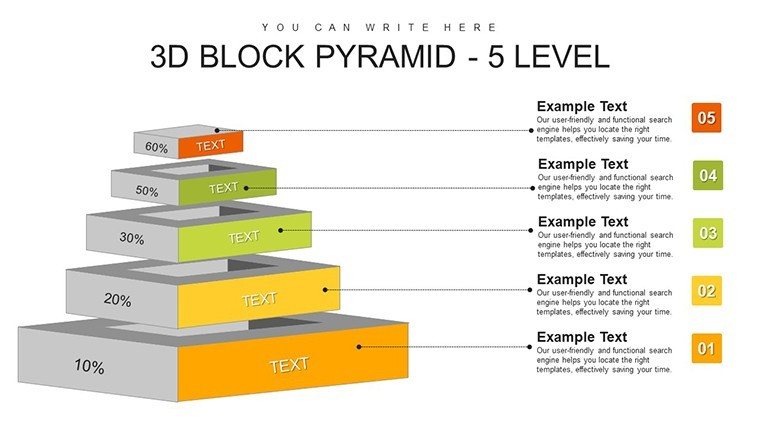
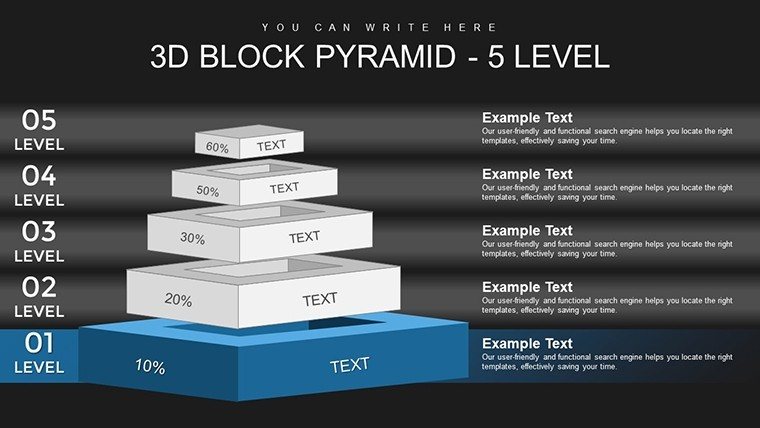
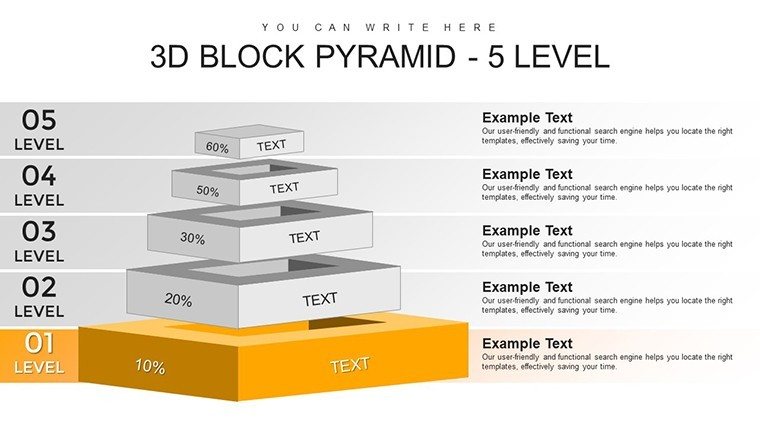
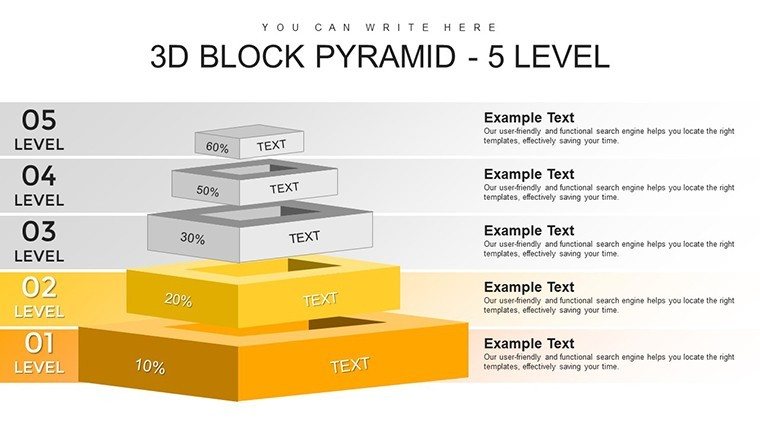
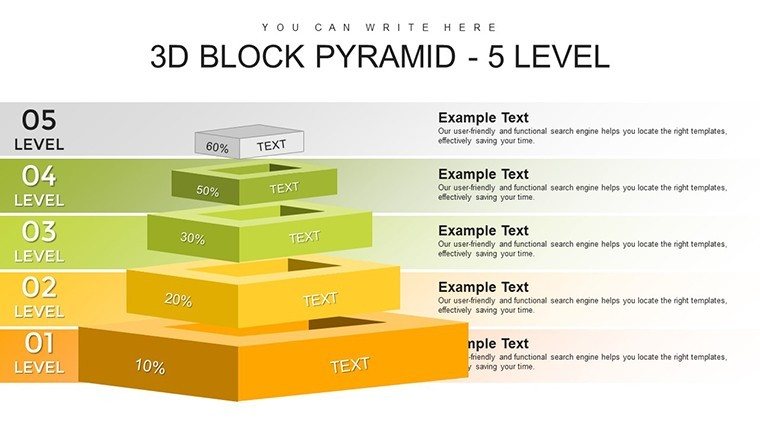
- Coordinated color palette for professional visual appeal
- High-contrast elements ensure readability on screens and projectors
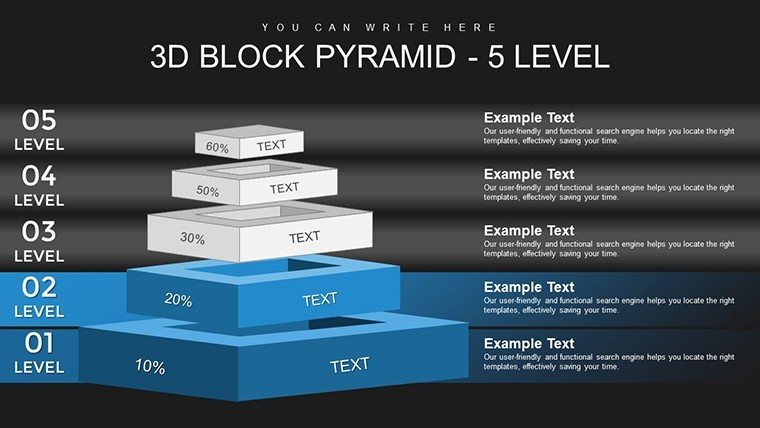
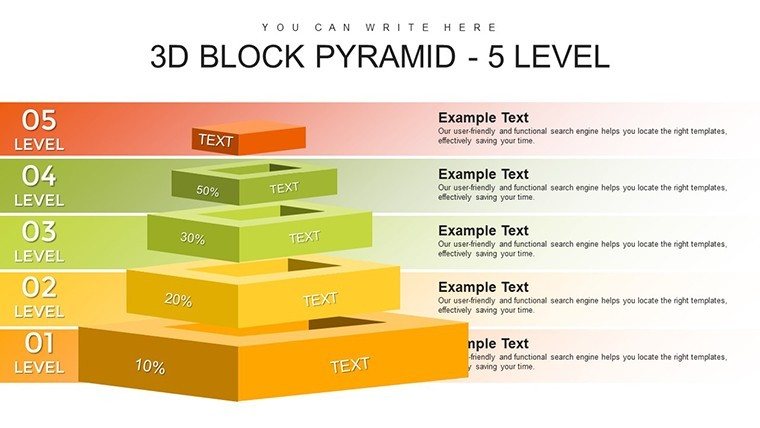
- Fully editable text, shapes, and colors in PowerPoint
- Clean layout focused on parallel performance comparison
How to Customize This Template
Open the downloaded file in Microsoft PowerPoint and replace placeholder data with your own metrics using simple click-and-edit functionality. Adjust segment colors to align with your brand guidelines, modify labels, and add annotations to highlight key differences. No advanced design skills are required - the template is built for quick, professional results in minutes.
Compatible with both Windows and Mac versions of PowerPoint (2010 and newer, including Microsoft 365).
Professional Use Cases
Management consultants use this layout to benchmark client departments against competitors during strategy workshops.
Business analysts compare regional sales performance in quarterly reviews to identify growth opportunities.
Operations teams evaluate efficiency metrics across multiple facilities to support resource planning.
Product managers analyze feature adoption rates across customer segments for roadmap prioritization.
Download this template today to streamline your data comparisons and deliver clearer presentations.
Frequently Asked Questions
Is this template fully editable in PowerPoint?Yes, every element - including text, colors, shapes, and layout - is 100% editable using standard PowerPoint tools. No additional software is needed.
What versions of PowerPoint are supported?The template is compatible with Microsoft PowerPoint 2010 and later, including Microsoft 365, on both Windows and Mac.
Can I change the colors to match my branding?Absolutely. The color palette is fully customizable, allowing you to align the design with your corporate identity in just a few clicks.
Is the download instant?Yes, immediately after purchase, you receive a direct download link to the PPTX file for instant access.
Can I use this template for client presentations?Yes, the license allows full commercial use, including client-facing presentations and internal business materials.
Good for
- Project roadmaps and sprint plans
- Product launch timelines
- Quarterly or annual review decks
- Company history and milestone summaries
Licence
reviews
The graph slides looked clear during our office meeting.
Needed something fast and this template did the job.
Some text placeholders were smaller than expected.
The colors were simple and not distracting.
Good enough for quick reports and updates.
FAQ
Will it work in Google Slides?
Are fonts embedded?
Can I use this for client work?
What's the refund policy?
Do you update the template after purchase?
Similar templates
See all PowerPoint Charts →

All 26 slides