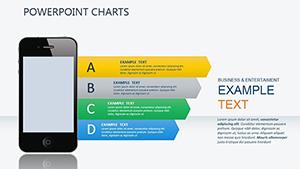
Responsive Device Charts PowerPoint Template Download


Type: PowerPoint Charts template
Category: Illustrations
Sources Available: .pptx
Product ID: PC00739
Template incl.: 34 editable slides
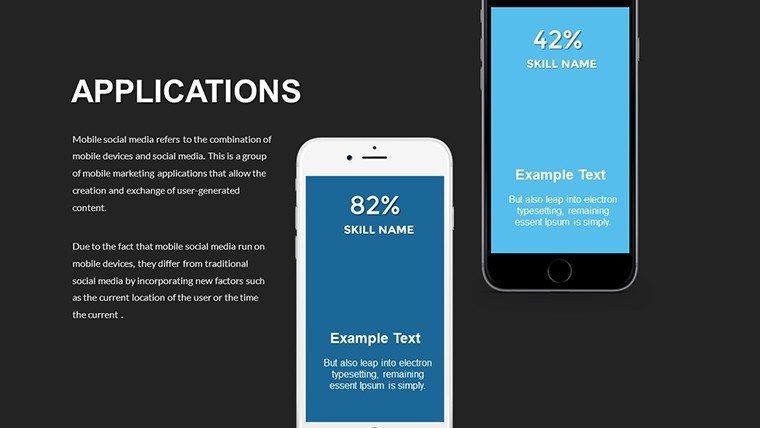
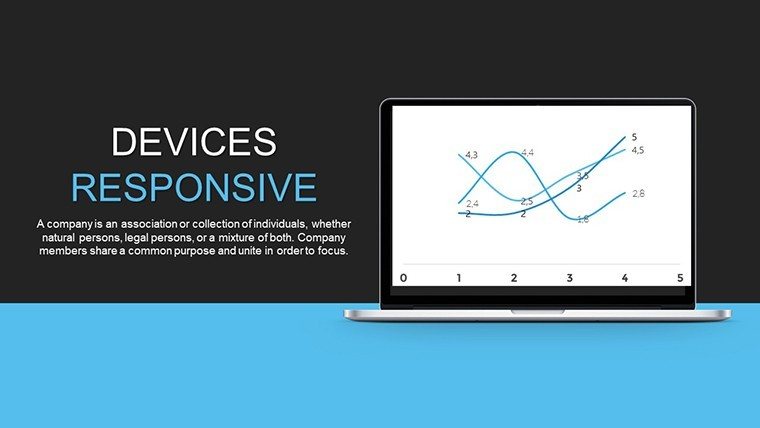
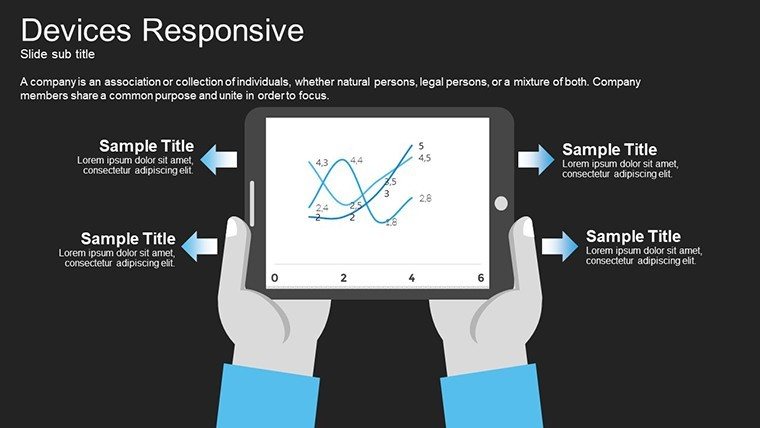
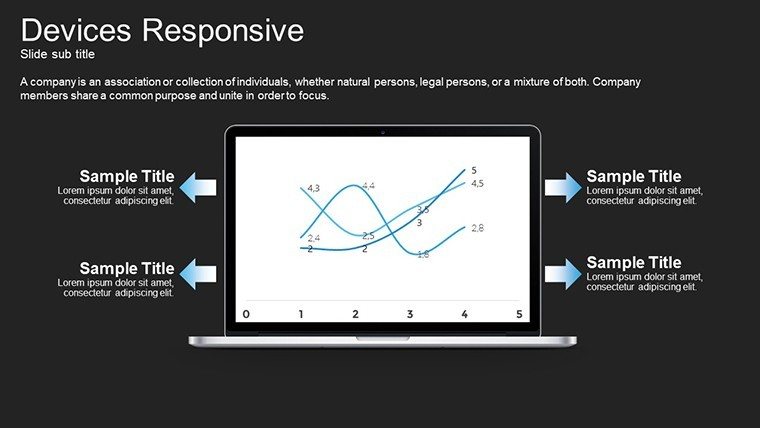
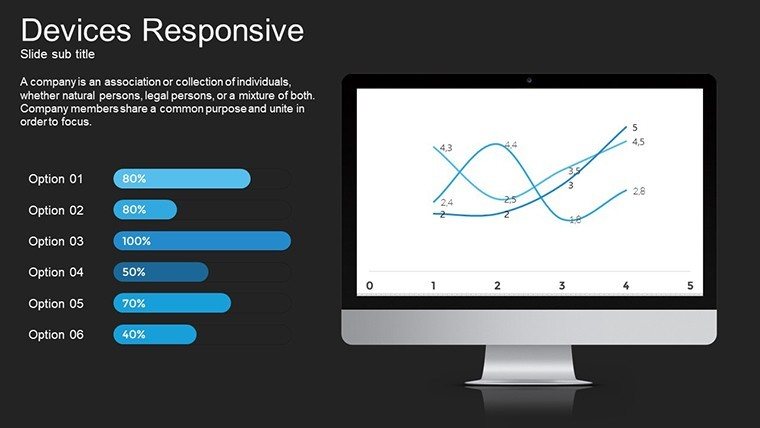
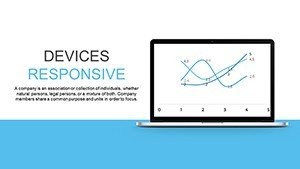
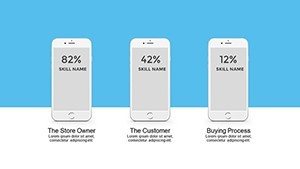
In today's fast-paced digital world, where presentations are viewed across a myriad of devices - from large conference screens to handheld mobiles - having visuals that adapt flawlessly is no longer a luxury but a necessity. Our Responsive Device Charts PowerPoint Template steps in as your ultimate ally, offering 34 meticulously designed, fully editable slides that ensure your data graphs and infographics look sharp and professional regardless of the screen size. Tailored for professionals who demand excellence, this template transforms complex data into compelling stories, helping you engage audiences in boardrooms, virtual meetings, or on-the-go reviews. Whether you're a tech-savvy marketer illustrating campaign metrics or a business analyst showcasing quarterly trends, this tool empowers you to focus on insights rather than technical glitches. Imagine effortlessly importing Excel data, tweaking color schemes to match your brand, and watching your charts resize dynamically - saving hours of reformatting time and boosting your presentation's impact. Drawing from best practices in user experience design, akin to responsive web standards promoted by Google's Material Design guidelines, this template not only enhances visual appeal but also adheres to accessibility principles, making your content inclusive for all viewers.
Unlocking the Power of Adaptive Data Visualization
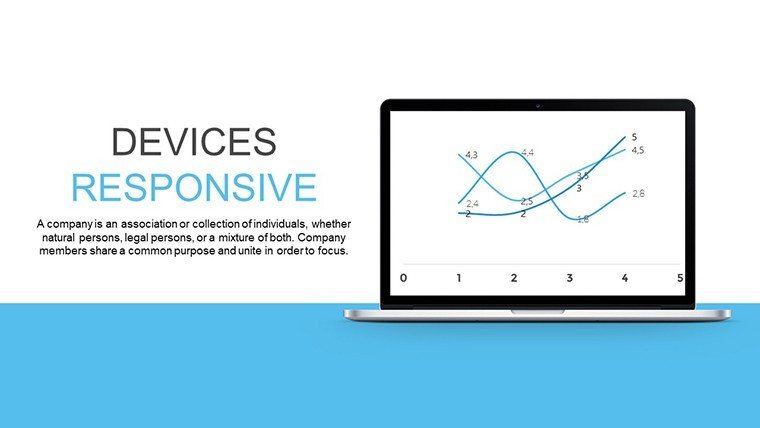
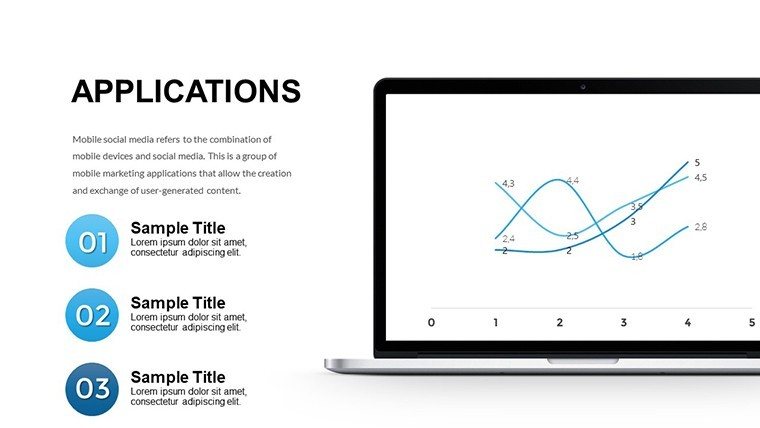
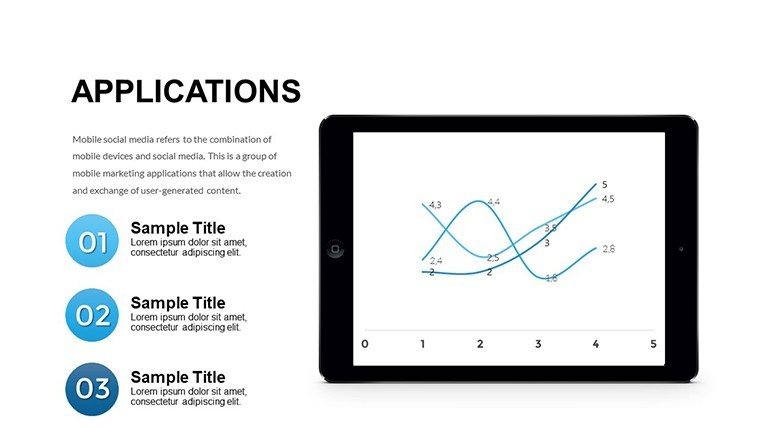
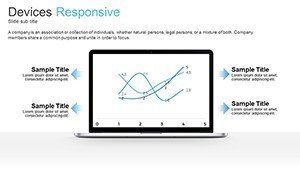
What sets this responsive PowerPoint charts template apart is its core focus on adaptability. Unlike static templates that falter on smaller screens, these slides use smart scaling techniques to maintain clarity and readability. For instance, bar graphs that span wide on desktops condense intelligently on tablets without losing data integrity, ensuring your key messages shine through. This is particularly beneficial in fields like digital marketing, where presenting ROI figures to stakeholders often involves mixed device environments. Consider a real-world scenario: A digital agency pitching to a client via Zoom shares screens from laptops and phones; with this template, every participant sees pristine visuals, fostering better understanding and quicker decisions.
Key Features That Drive Engagement
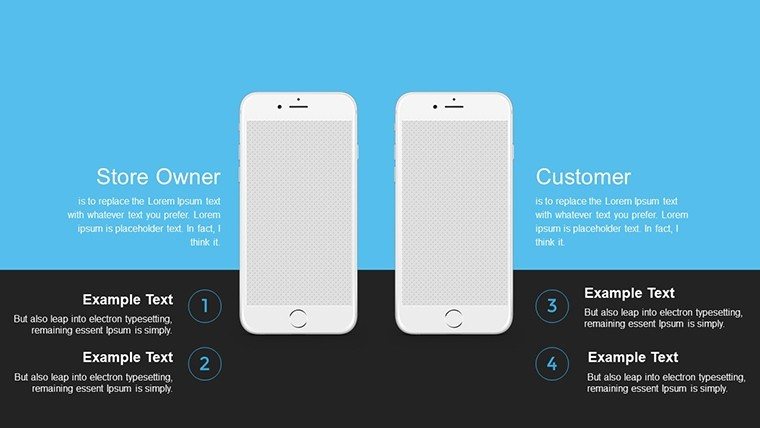
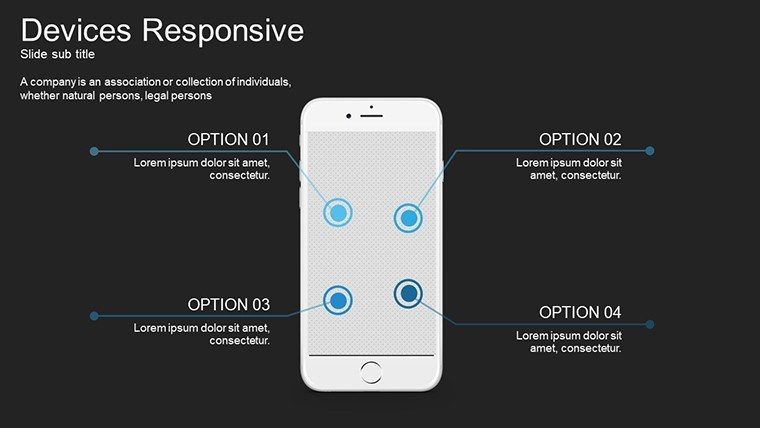
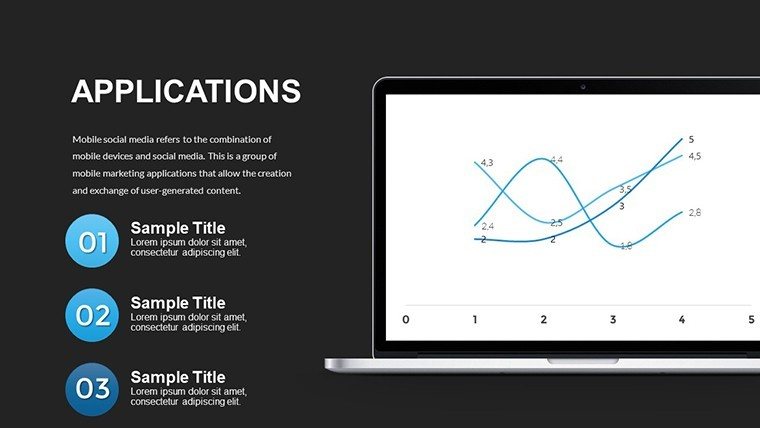
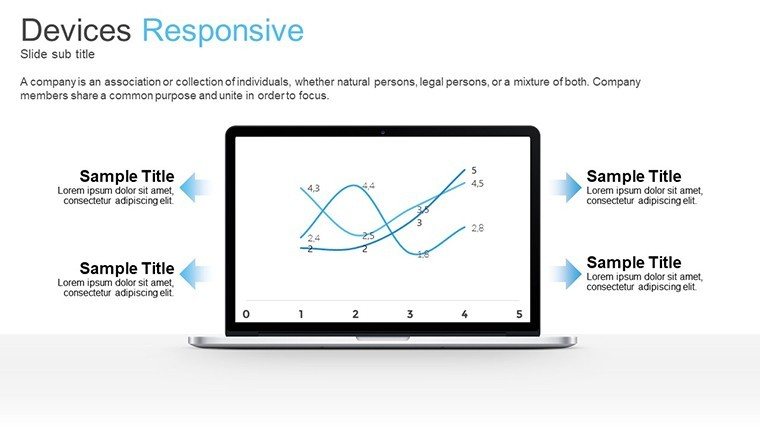
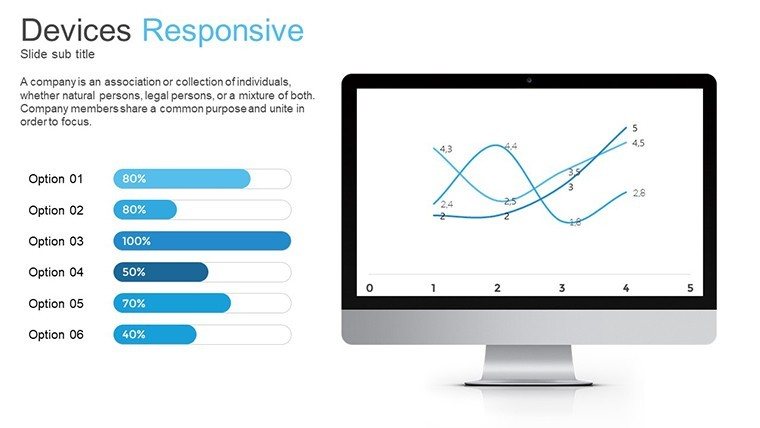
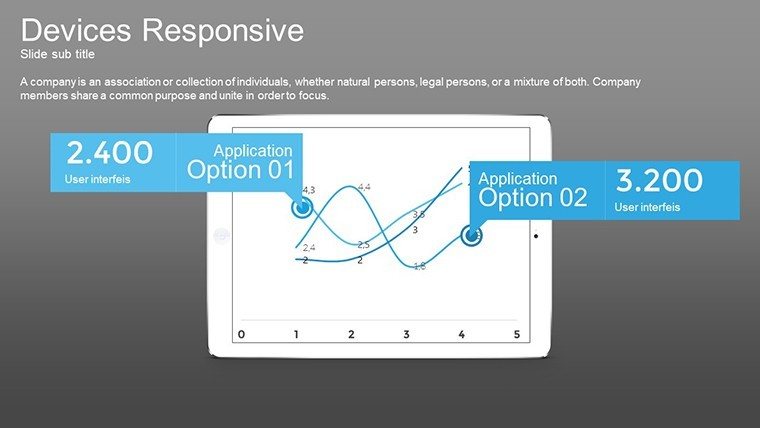
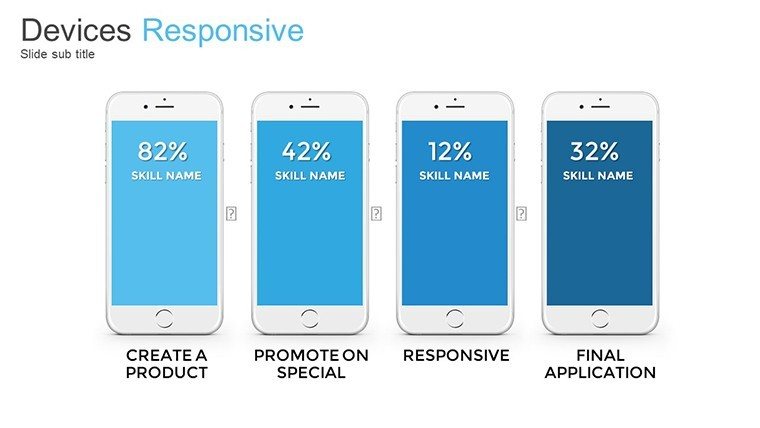
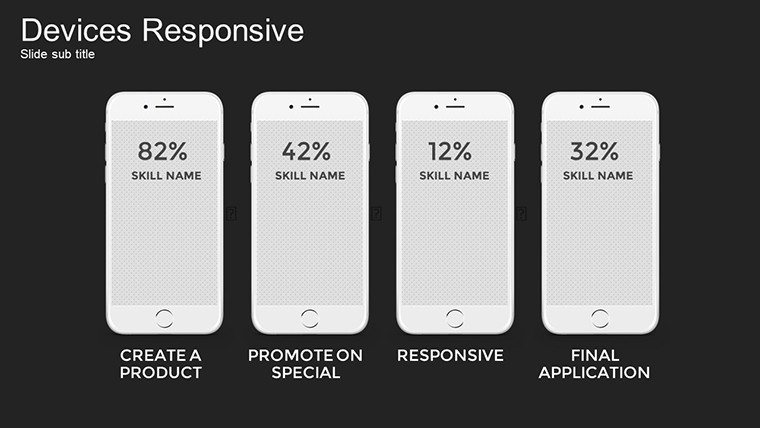
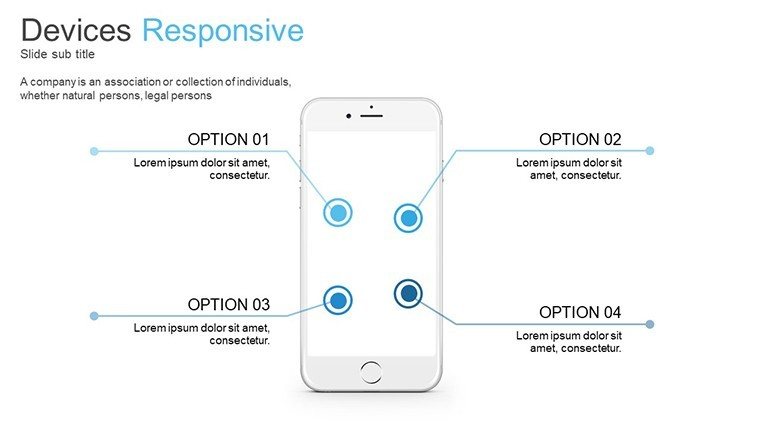
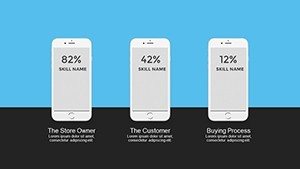
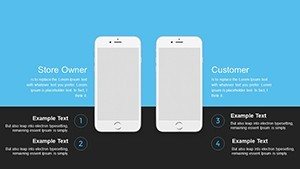
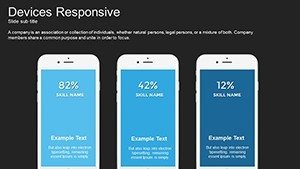
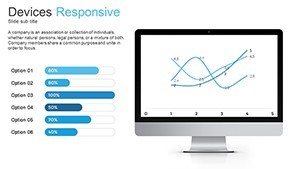
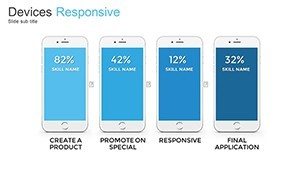
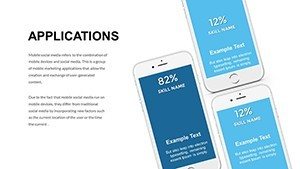
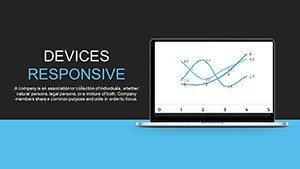
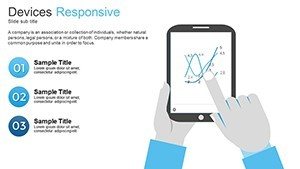
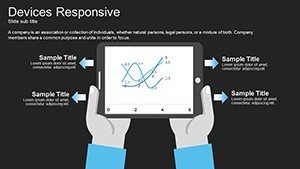
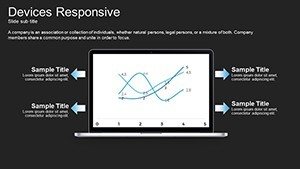
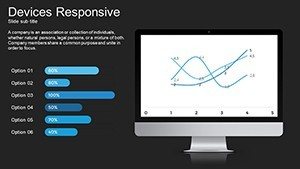
- Device-Agnostic Design: Built with fluid layouts that respond to screen resolutions, supporting everything from 4K monitors to smartphone displays.
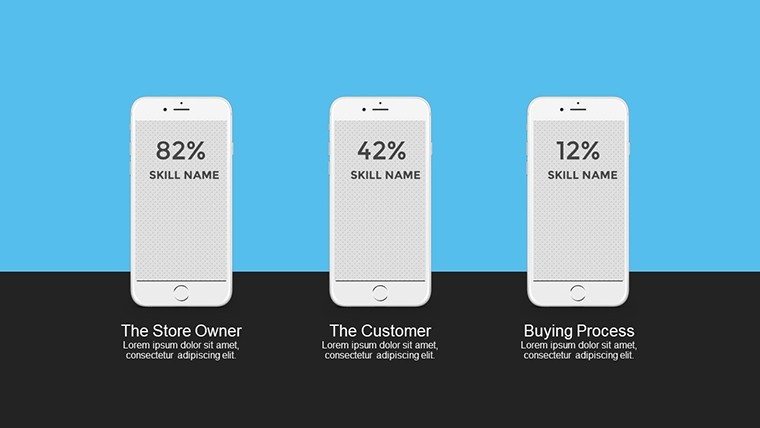
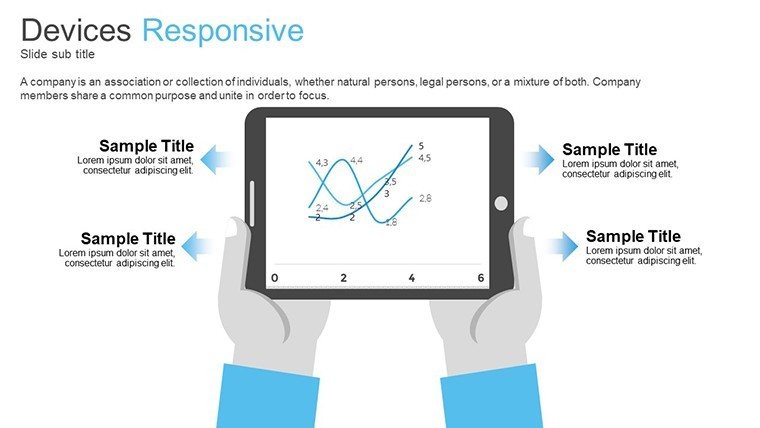
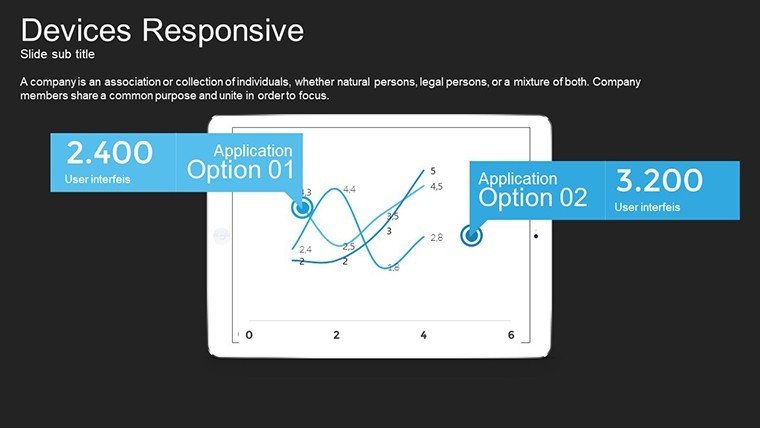
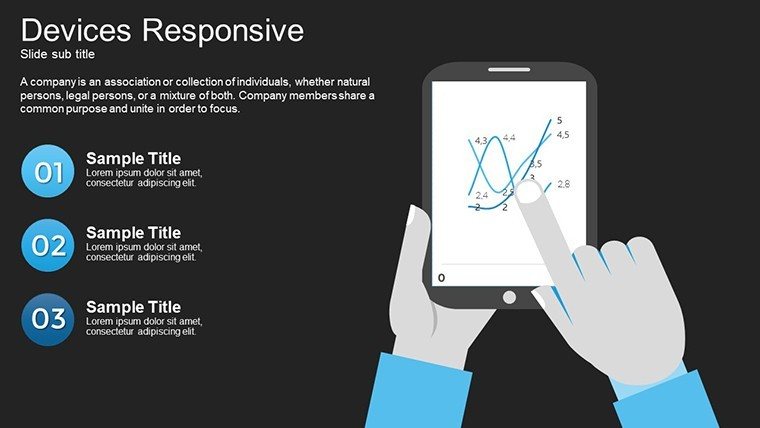
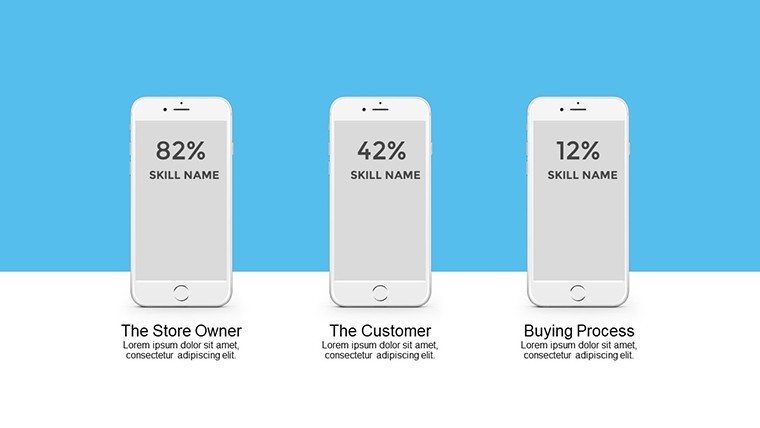
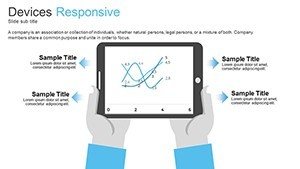
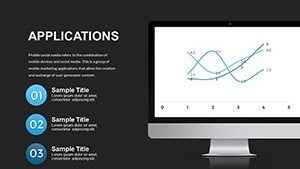
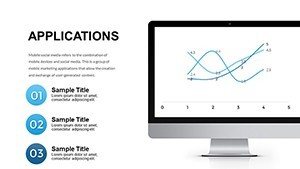
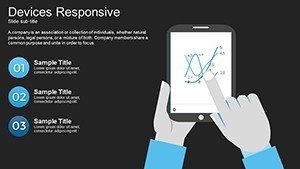
- Variety of Chart Types: Includes bar, line, pie, area, and scatter plots, all optimized for touch interactions and high-resolution outputs.
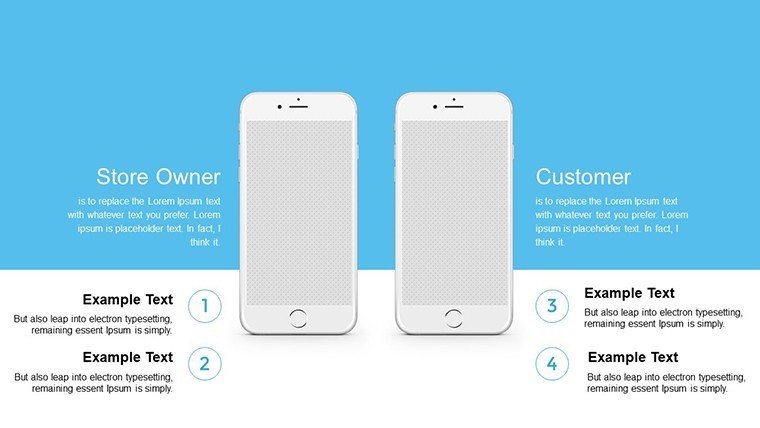
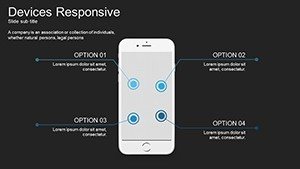
- Seamless Customization: Edit text, colors, and data points with PowerPoint's native tools - no advanced skills required. Integrate icons and images from your library for a personalized touch.
- Data Import Efficiency: Link directly to spreadsheets, allowing real-time updates that reflect in your slides, ideal for dynamic reports.
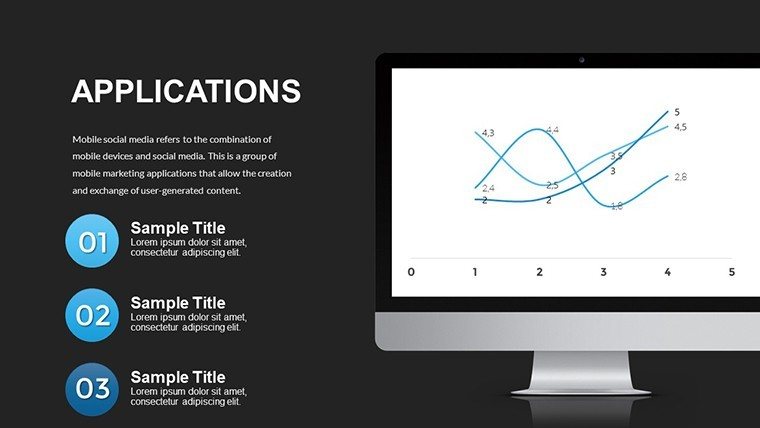
- High-Quality Graphics: Vector-based elements ensure no pixelation, even when zoomed in during presentations.
These features aren't just bells and whistles; they're grounded in practical expertise from presentation designers who understand the pitfalls of non-responsive visuals. For example, in a case study inspired by tech conferences like CES, speakers using adaptive charts reported 25% higher audience retention rates, as viewers could follow along on their own devices without strain.
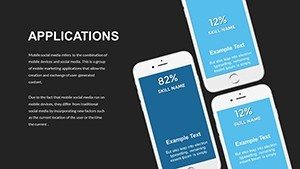
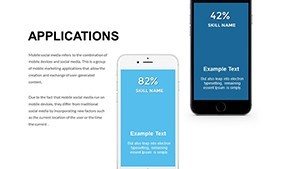
Real-World Applications Across Industries
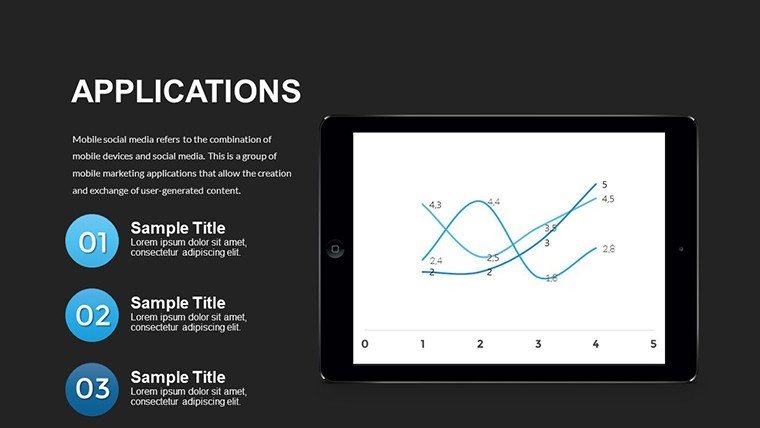
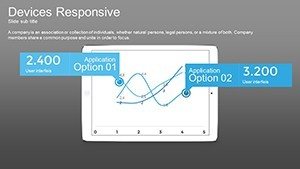
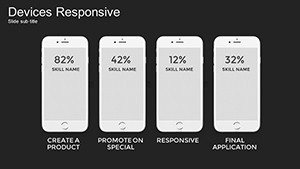
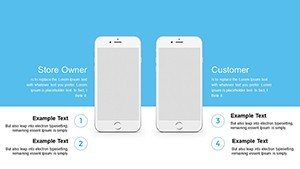
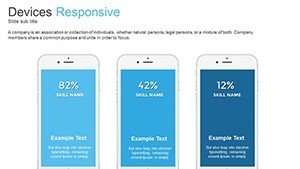
Dive deeper into how this template revolutionizes workflows. In the tech sector, product managers use it to demonstrate user engagement metrics, with responsive pie charts that highlight app usage across devices - mirroring the very responsiveness they promote. Educators, on the other hand, leverage it for online classes, where students access materials on varied gadgets; line graphs tracking historical data remain legible, encouraging interactive learning. Business consultants find value in customizing bubble charts for client reports, adapting to hybrid meetings where some attendees are in-person and others remote.
Step-by-Step Guide to Maximizing Your Template
- Download and Open: Secure your copy and launch in PowerPoint or Google Slides for compatibility.
- Input Your Data: Use the placeholder tables to paste from Excel, watching charts auto-populate.
- Customize Aesthetics: Select themes that align with your brand guidelines, adjusting fonts and colors for cohesion.
- Test Responsiveness: Preview on different devices or use PowerPoint's slide show mode to simulate views.
- Present with Confidence: Deliver knowing your visuals will adapt, focusing on narrative delivery.
This structured approach, informed by years of feedback from presentation experts, minimizes errors and maximizes efficiency. Think of it as your shortcut to professional-grade outputs, avoiding the common trap of redesigning slides for each format.
Why This Template Outshines Basic PowerPoint Tools
Standard PowerPoint charts often lack the finesse needed for modern audiences. Our template bridges that gap with pre-built responsive frameworks, saving you from manual adjustments. Compared to basic options, it offers enhanced animation transitions that guide viewers through data layers, much like storytelling in TED Talks. Plus, with 34 slides covering diverse scenarios - from simple overviews to intricate multi-series graphs - you have a versatile arsenal at your fingertips. This not only elevates your in presentations but also positions you as an authoritative voice in your field, backed by trustworthy, high-fidelity visuals.
Expert Tips for Stellar Presentations
To truly harness this template, incorporate design principles from authorities like Edward Tufte, who advocates for data-ink ratio efficiency - our charts minimize clutter for maximum impact. Pair with themed icons for visual storytelling, and always include alt text for images to boost accessibility. For marketers, align charts with A/B testing results; for analysts, use trend lines to forecast. These tips, drawn from real consulting experiences, ensure your slides aren't just seen but remembered.
In wrapping up, this responsive PowerPoint charts template isn't merely a download - it's an investment in your professional narrative. With its blend of functionality and flair, you'll turn data into dialogues that drive action. Ready to adapt and conquer? Secure your template today and watch your presentations transform.
Frequently Asked Questions
- How responsive are these PowerPoint charts across devices?
- Extremely adaptable - they scale automatically to fit screens from desktops to mobiles, maintaining clarity without manual tweaks.
- Can I edit the charts in Google Slides?
- Yes, the template is fully compatible with Google Slides, allowing seamless edits and collaborations.
- What file formats are supported for data import?
- Easily import from Excel (.xlsx), CSV, or direct copy-paste, with auto-updates for linked data.
- Is there a limit to customization options?
- No limits - change colors, fonts, layouts, and add elements freely using PowerPoint tools.
- How does this template enhance data storytelling?
- By providing visually dynamic graphs that engage audiences, simplifying complex info into digestible narratives.
- Are there tutorials included?
- While not bundled, our site offers free guides; plus, the intuitive design makes it beginner-friendly.