00% off everything!
SALE ENDS TODAY, Saturday November 0
Promo code "00LAYOUTS"
Time Left to Save
00:00:00

Reliance Trends World PowerPoint Charts Template: Visualize Trends Effortlessly

5
161 ratings
Reliance Trends World PowerPoint Charts Template: Visualize Trends Effortlessly - Slide #0
Reliance Trends World PowerPoint Charts Template: Visualize Trends Effortlessly - Slide #1
Reliance Trends World PowerPoint Charts Template: Visualize Trends Effortlessly - Slide #2
Reliance Trends World PowerPoint Charts Template: Visualize Trends Effortlessly - Slide #3
Reliance Trends World PowerPoint Charts Template: Visualize Trends Effortlessly - Slide #4
Reliance Trends World PowerPoint Charts Template: Visualize Trends Effortlessly - Slide #5
Reliance Trends World PowerPoint Charts Template: Visualize Trends Effortlessly - Slide #6
Reliance Trends World PowerPoint Charts Template: Visualize Trends Effortlessly - Slide #7
Reliance Trends World PowerPoint Charts Template: Visualize Trends Effortlessly - Slide #8
Reliance Trends World PowerPoint Charts Template: Visualize Trends Effortlessly - Slide #9
Reliance Trends World PowerPoint Charts Template: Visualize Trends Effortlessly - Slide #10
Reliance Trends World PowerPoint Charts Template: Visualize Trends Effortlessly - Slide #11
Reliance Trends World PowerPoint Charts Template: Visualize Trends Effortlessly - Slide #12
Reliance Trends World PowerPoint Charts Template: Visualize Trends Effortlessly - Slide #13
Reliance Trends World PowerPoint Charts Template: Visualize Trends Effortlessly - Slide #14
Reliance Trends World PowerPoint Charts Template: Visualize Trends Effortlessly - Slide #15
Reliance Trends World PowerPoint Charts Template: Visualize Trends Effortlessly - Slide #16
Reliance Trends World PowerPoint Charts Template: Visualize Trends Effortlessly - Slide #17
Reliance Trends World PowerPoint Charts Template: Visualize Trends Effortlessly - Slide #18
Reliance Trends World PowerPoint Charts Template: Visualize Trends Effortlessly - Slide #19
Reliance Trends World PowerPoint Charts Template: Visualize Trends Effortlessly - Slide #20
Reliance Trends World PowerPoint Charts Template: Visualize Trends Effortlessly - Slide #21
Reliance Trends World PowerPoint Charts Template: Visualize Trends Effortlessly - Slide #22
Reliance Trends World PowerPoint Charts Template: Visualize Trends Effortlessly - Slide #23
Reliance Trends World PowerPoint Charts Template: Visualize Trends Effortlessly - Slide #24
Reliance Trends World PowerPoint Charts Template: Visualize Trends Effortlessly - Slide #25
Reliance Trends World PowerPoint Charts Template: Visualize Trends Effortlessly - Slide #26
Reliance Trends World PowerPoint Charts Template: Visualize Trends Effortlessly - Slide #27
Reliance Trends World PowerPoint Charts Template: Visualize Trends Effortlessly - Slide #28
Reliance Trends World PowerPoint Charts Template: Visualize Trends Effortlessly - Slide #29
Reliance Trends World PowerPoint Charts Template: Visualize Trends Effortlessly - Slide #30
Reliance Trends World PowerPoint Charts Template: Visualize Trends Effortlessly - Slide #31
Reliance Trends World PowerPoint Charts Template: Visualize Trends Effortlessly - Slide #32
Reliance Trends World PowerPoint Charts Template: Visualize Trends Effortlessly - Slide #33
Reliance Trends World PowerPoint Charts Template: Visualize Trends Effortlessly - Slide #34
Reliance Trends World PowerPoint Charts Template: Visualize Trends Effortlessly - Slide #35
Reliance Trends World PowerPoint Charts Template: Visualize Trends Effortlessly - Slide #36
Reliance Trends World PowerPoint Charts Template: Visualize Trends Effortlessly - Slide #37
Reliance Trends World PowerPoint Charts Template: Visualize Trends Effortlessly - Slide #38
Reliance Trends World PowerPoint Charts Template: Visualize Trends Effortlessly - Slide #39
Reliance Trends World PowerPoint Charts Template: Visualize Trends Effortlessly - Slide #40
Reliance Trends World PowerPoint Charts Template: Visualize Trends Effortlessly - Slide #41
Reliance Trends World PowerPoint Charts Template: Visualize Trends Effortlessly - Slide #42
Reliance Trends World PowerPoint Charts Template: Visualize Trends Effortlessly - Slide #43
thumbnail slide #0
thumbnail slide #1
thumbnail slide #2
thumbnail slide #3
thumbnail slide #4
thumbnail slide #5
thumbnail slide #6
thumbnail slide #7
thumbnail slide #8
thumbnail slide #9
thumbnail slide #10
thumbnail slide #11
thumbnail slide #12
thumbnail slide #13
thumbnail slide #14
thumbnail slide #15
thumbnail slide #16
thumbnail slide #17
thumbnail slide #18
thumbnail slide #19
thumbnail slide #20
thumbnail slide #21
thumbnail slide #22
thumbnail slide #23
thumbnail slide #24
thumbnail slide #25
thumbnail slide #26
thumbnail slide #27
thumbnail slide #28
thumbnail slide #29
thumbnail slide #30
thumbnail slide #31
thumbnail slide #32
thumbnail slide #33
thumbnail slide #34
thumbnail slide #35
thumbnail slide #36
thumbnail slide #37
thumbnail slide #38
thumbnail slide #39
thumbnail slide #40
thumbnail slide #41
thumbnail slide #42
thumbnail slide #43

Type: PowerPoint Charts template

Category: Arrows, Illustrations

Sources Available: .pptx

Product ID: PC00708

Template incl.: 44 editable slides

Purchase this template
$ 22.00

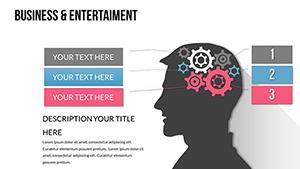
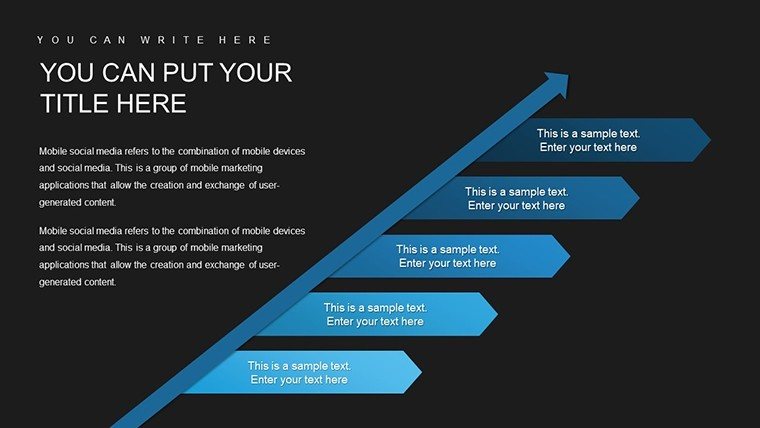
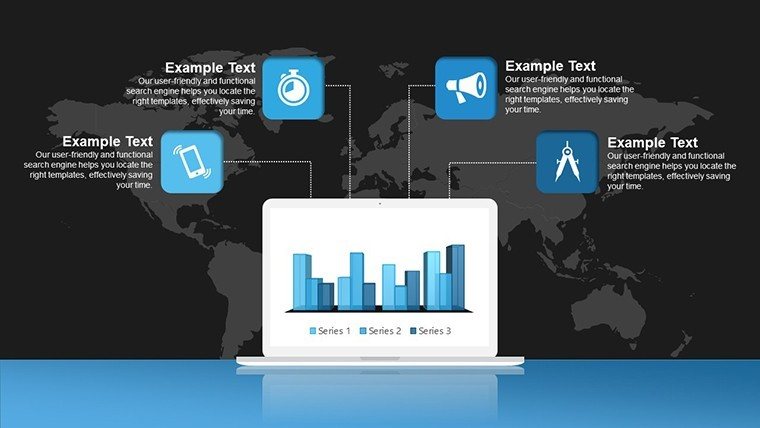
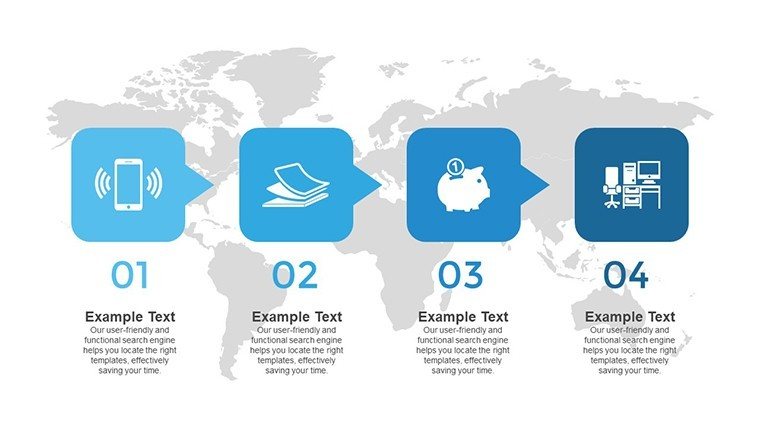
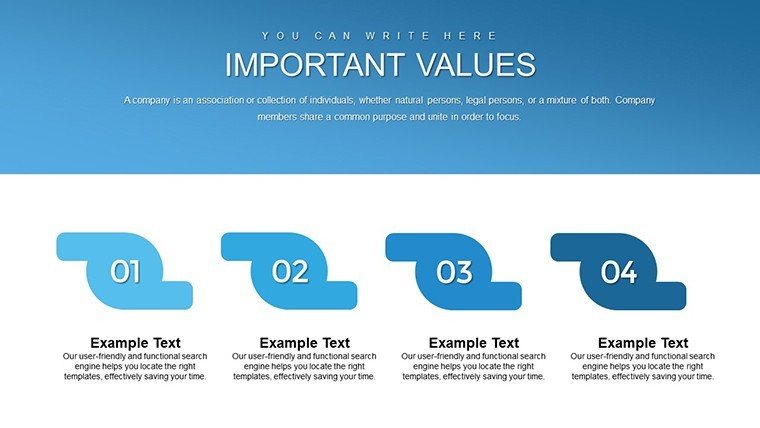
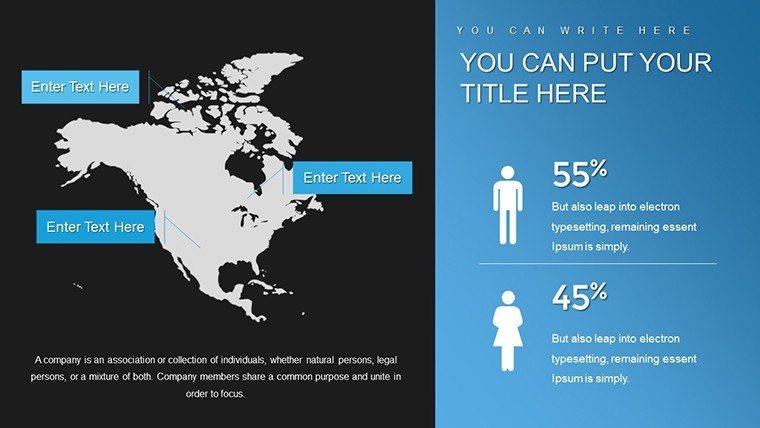
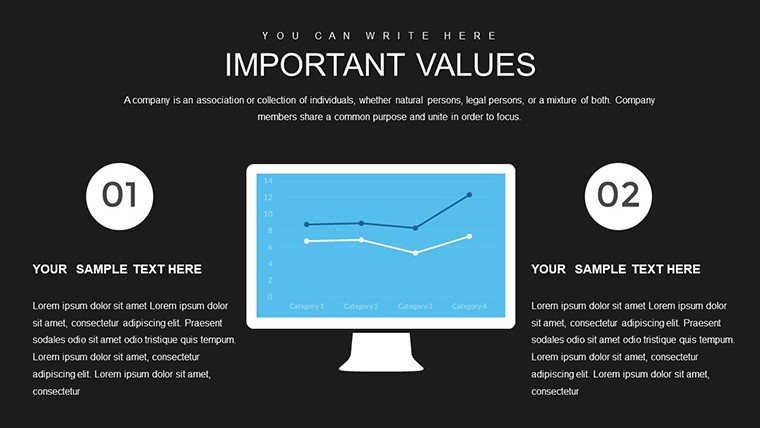
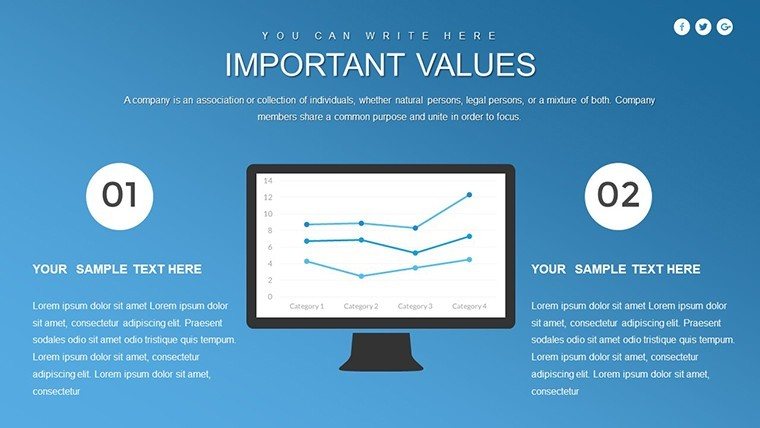
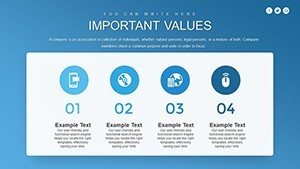
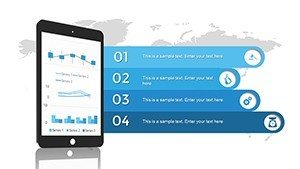
Trends shape industries, and presenting them effectively can set you apart. The Reliance Trends World PowerPoint Charts Template brings 44 editable slides to life, blending arrows, illustrations, and diverse graphs for a visually rich experience. Ideal for business pros, educators, and consultants tracking market shifts or teaching concepts, this template simplifies complex trend data into engaging stories. Envision using line charts to forecast consumer behavior in a client meeting, or pie charts to break down global trends in a classroom - all with a user-friendly setup that saves time and amplifies impact. It's more than slides; it's a tool to make your insights shine, drawing on aesthetic functionality to captivate diverse audiences.

Harnessing Trends Through Superior Visualization

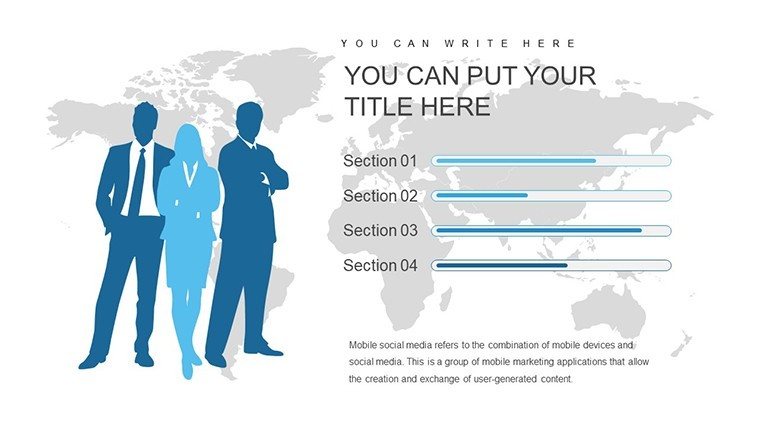
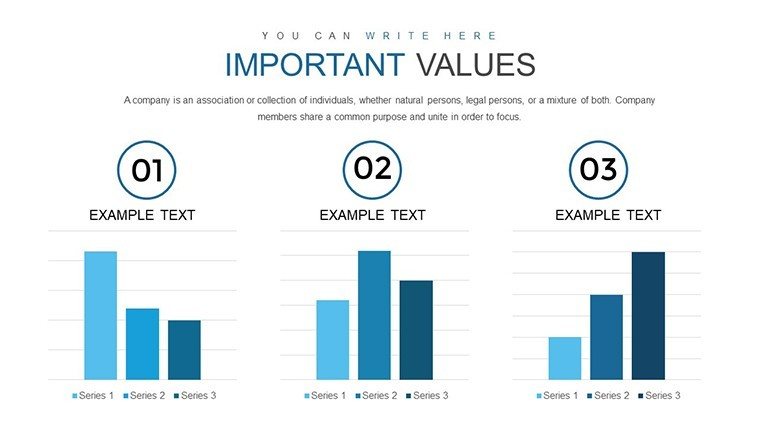
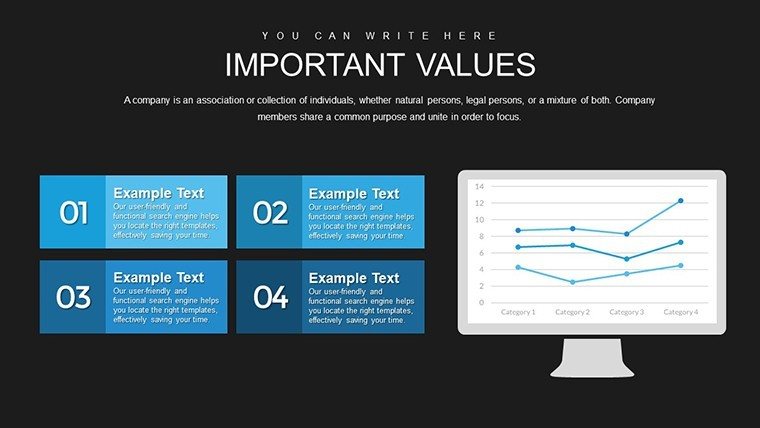
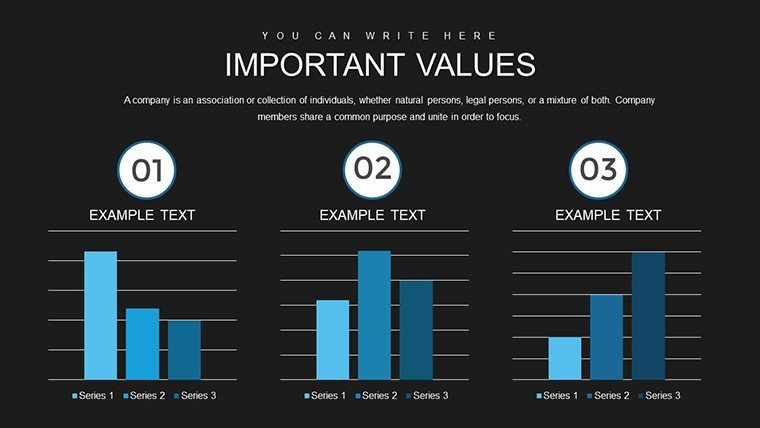
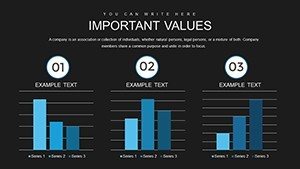
Understanding trends requires tools that go beyond basics. This template, inspired by data viz leaders like Tableau's principles, offers a variety of charts to map everything from economic shifts to consumer patterns. For consultants analyzing retail trends, bar charts can compare sales across seasons, providing clear, actionable visuals that drive strategy.

Essential Features for Trend Mastery

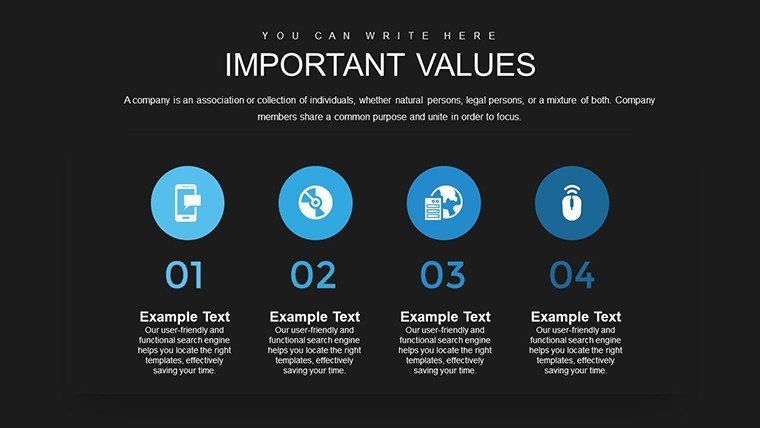
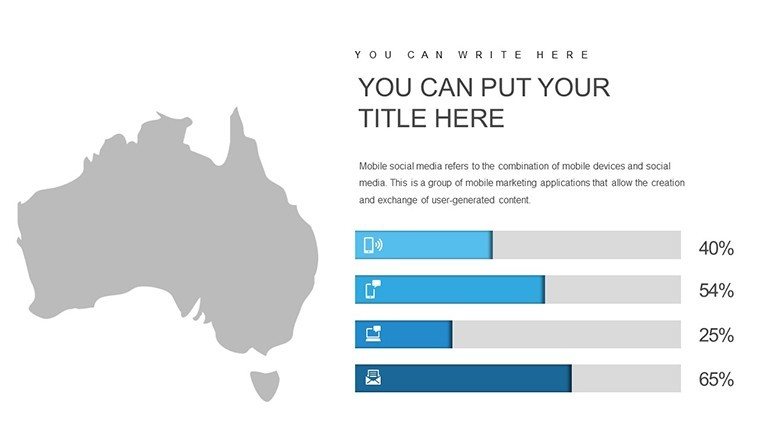
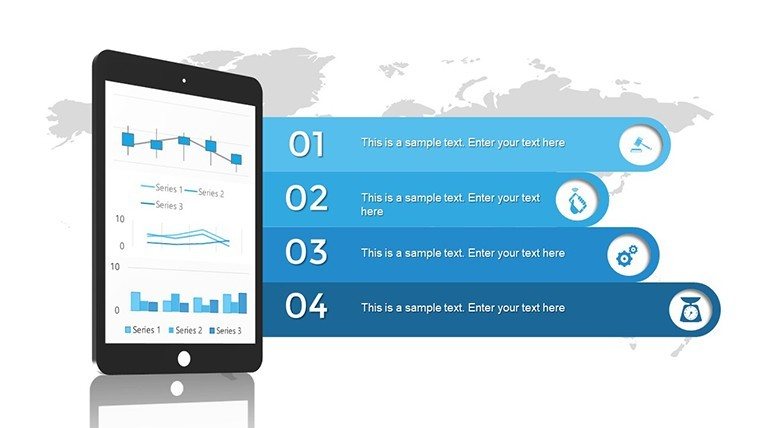
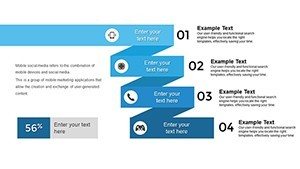
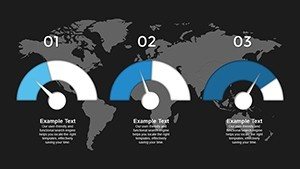
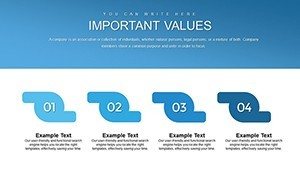
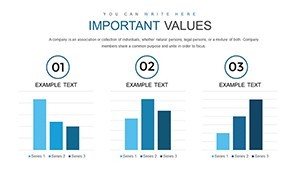
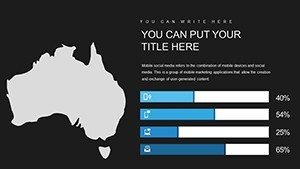
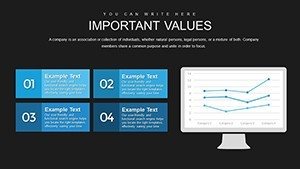
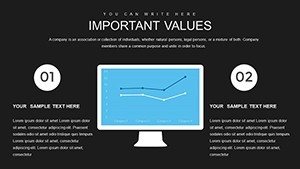
  • Diverse Graph Options: Bar, line, pie, and specialty charts for comprehensive trend depiction.
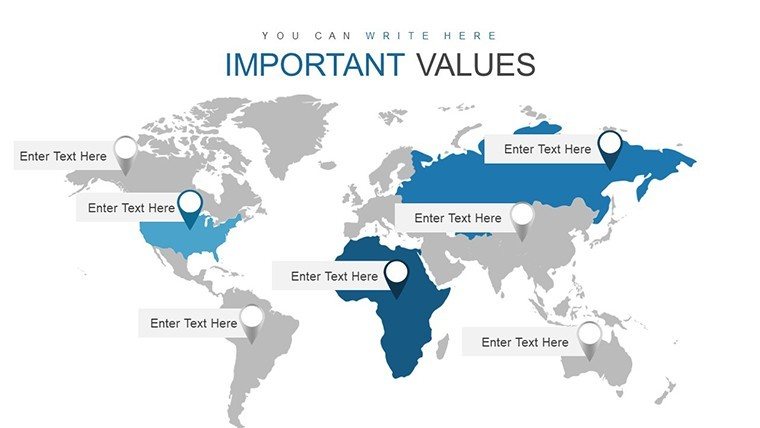
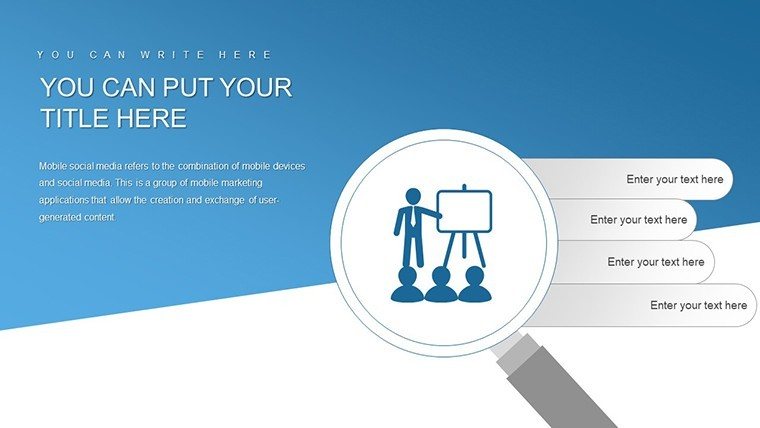
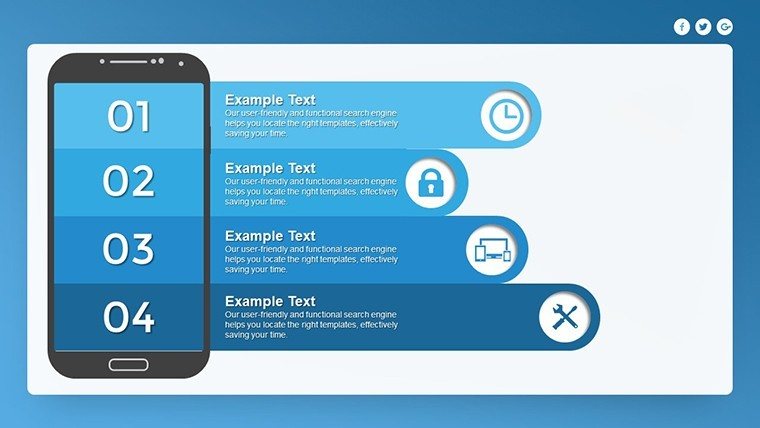
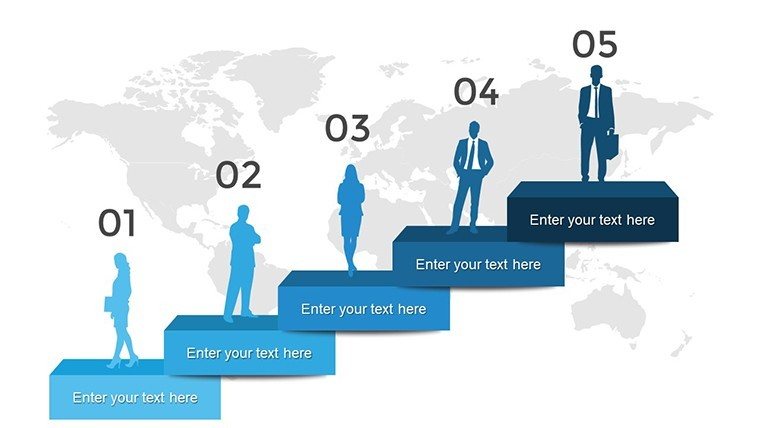
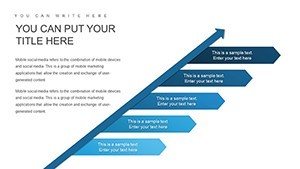
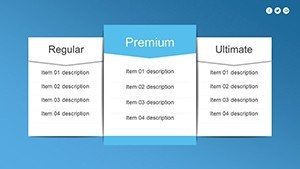
  • Customizable Elements: Tailor arrows and illustrations to fit your narrative and brand aesthetics.
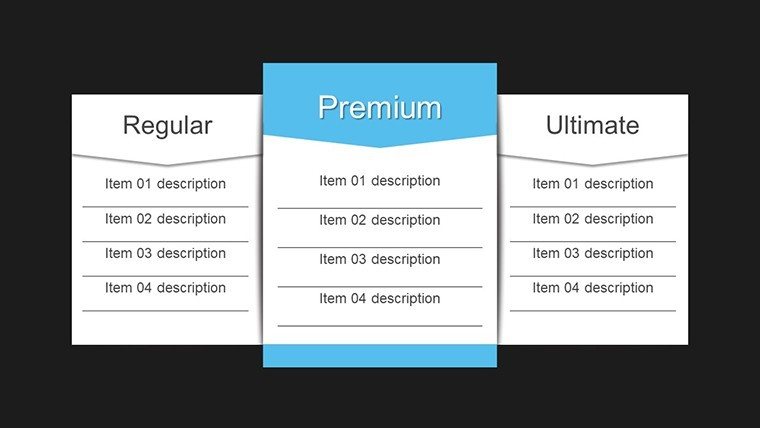
  • Intuitive Editing: Simple interface for quick modifications, no design degree needed.
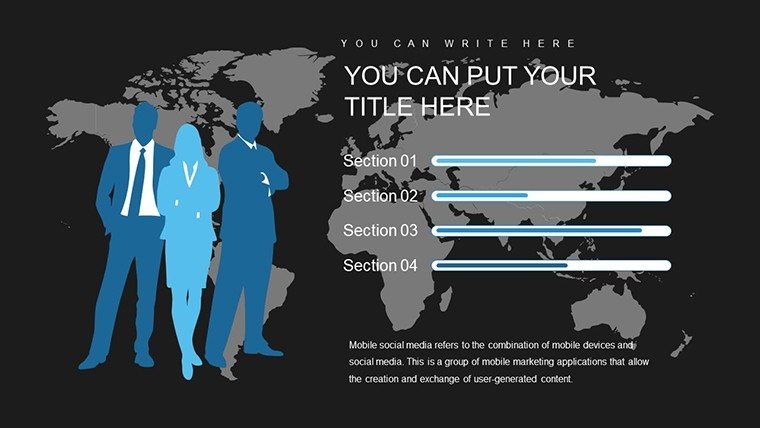
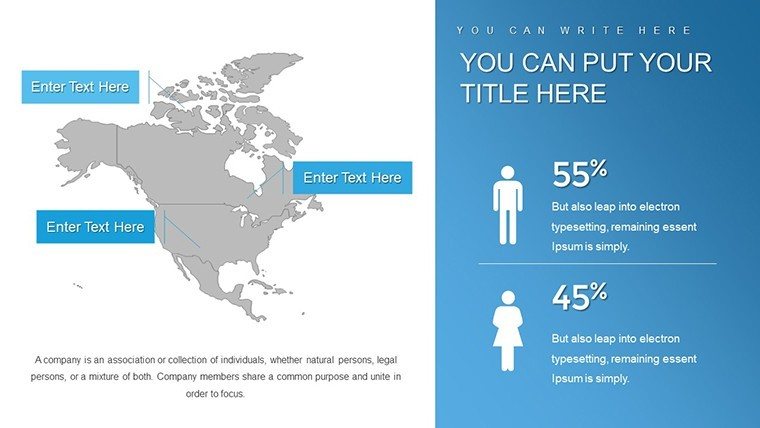
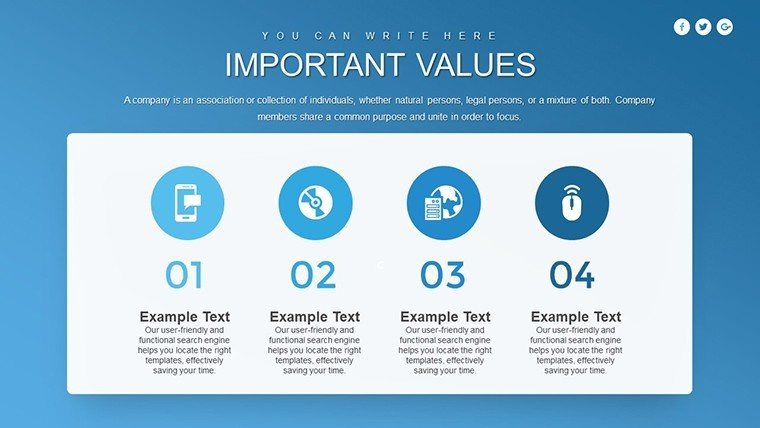
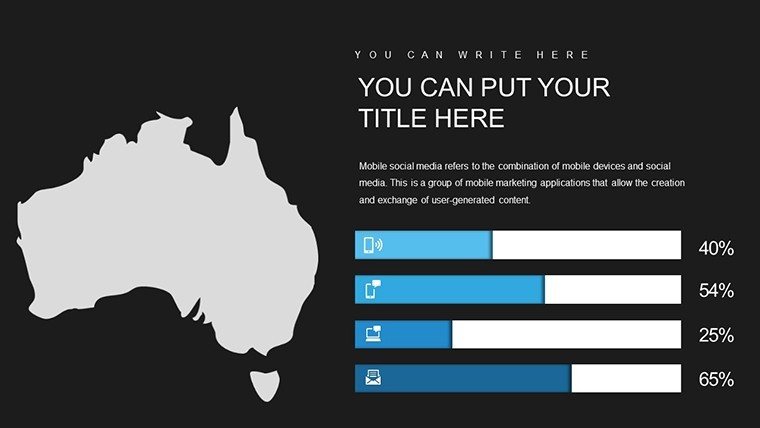
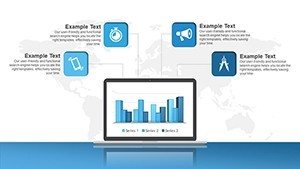
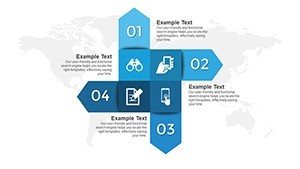
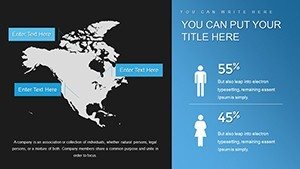
  • Illustration Integration: Built-in visuals to enhance data stories without extra effort.
  • Instant Accessibility: Download and start using immediately for timely presentations.

These features enable a polished, consistent output, turning raw trend data into persuasive visuals that resonate.

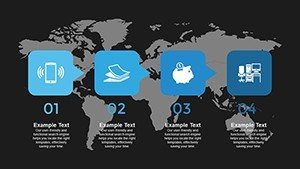
Versatile Uses Across Sectors

Whether in boardrooms or lecture halls, trends demand clear communication. This template excels by offering slides for various contexts - like using line graphs for stock trend analysis in finance reports, or illustrations for educational modules on cultural shifts.

Detailed Use Case: Client Trend Report

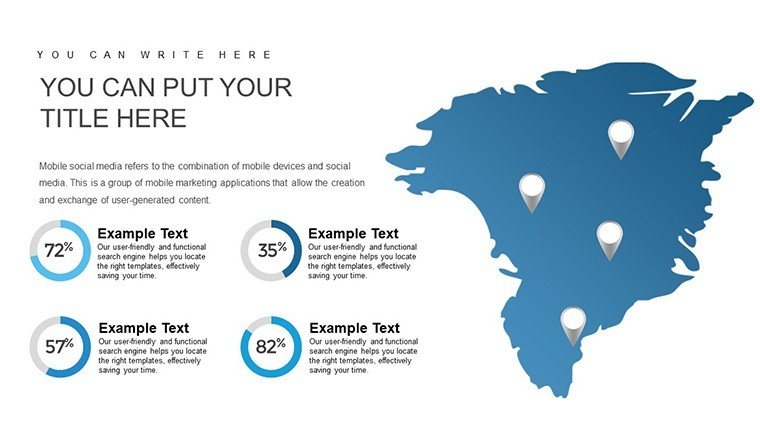
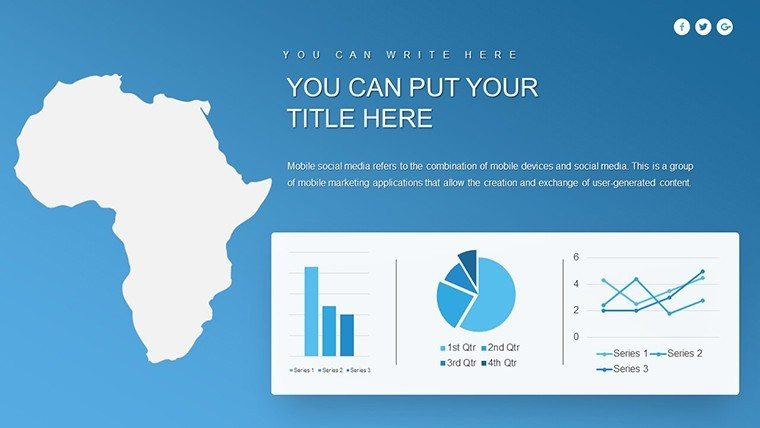
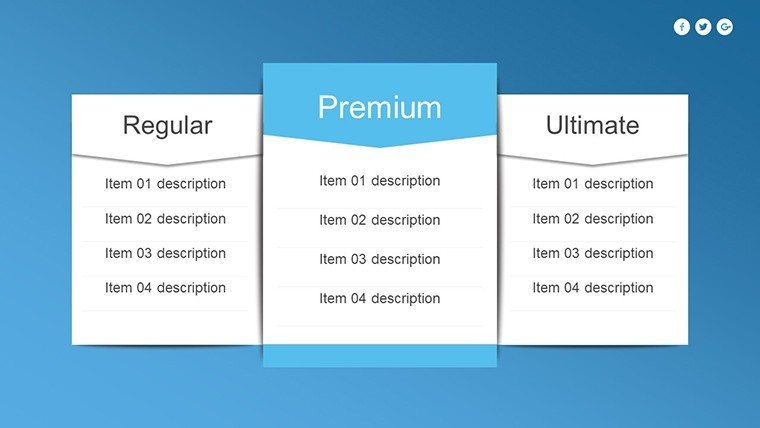
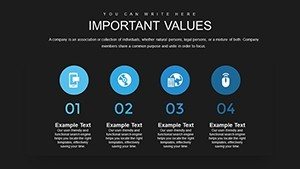
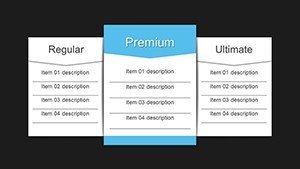
  1. Begin with Overview: Use pie charts to segment trend categories.
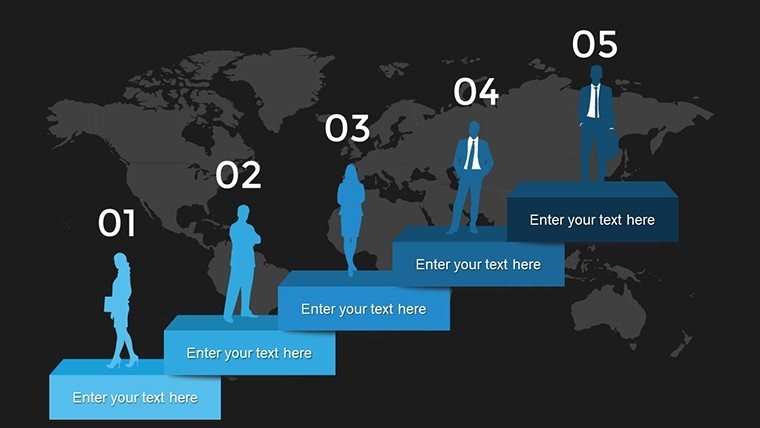
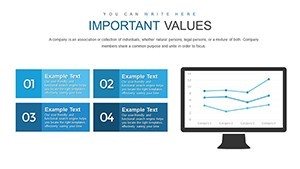
  2. Analyze Data: Deploy line charts to show evolution over time.
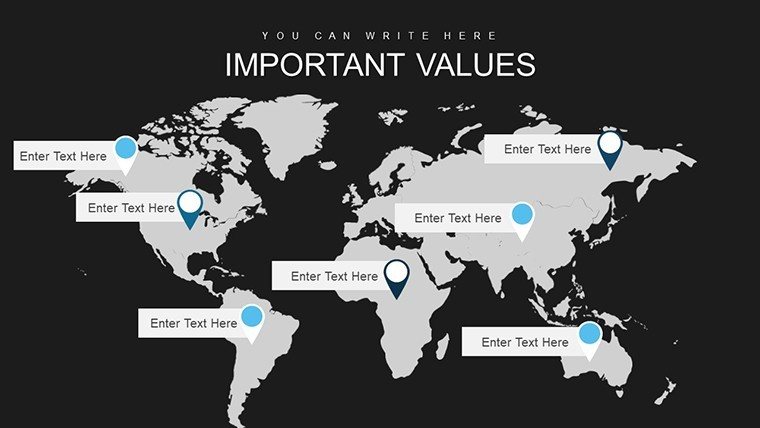
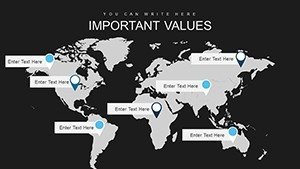
  3. Illustrate Impacts: Add arrows to highlight key influences.
  4. Conclude Strongly: Summarize with integrated visuals for memorable takeaways.

Outperforming standard PowerPoint with its themed illustrations, this template can enhance audience retention, echoing findings from visualization studies by experts like Stephen Few.

Tips for Trend-Focused Excellence

Incorporate this into workflows by linking to data sources for auto-updates. Reference authoritative bodies like the World Economic Forum for trend accuracy in your slides. Tip: Use contrasting colors in pie charts for better distinction; another: Employ arrows to guide viewer eyes through complex trends.

For researchers, it means deeper insights; for educators, more engaging lessons. It tackles common issues like bland visuals, delivering value through enhanced clarity.

Beneficiaries of Trend Visualization

  • Business Consultants: Impress clients with trend-driven strategies.
  • Educators: Teach trends with vivid, interactive aids.
  • Researchers: Communicate findings with precision and style.

It's designed to elevate how you handle and present trends.

Step Into a World of Visual Trends Today

Unlock the potential of your data with the Reliance Trends World PowerPoint Charts Template - download and start visualizing success.

Frequently Asked Questions

How many chart variations are included?

Over a dozen, including bar, line, and pie, plus custom illustrations.

Can I add my own images?

Yes, easily insert and integrate with existing elements.

Is it suitable for large presentations?

With 44 slides, it's scalable for extensive trend analyses.

What about updates or support?

Free updates available; contact support for any issues.

Compatible with Mac PowerPoint?

Yes, fully functional on both Windows and Mac versions.