Fan Indicator PowerPoint Charts Template: Revolutionize Your Data Displays


Type: PowerPoint Charts template
Category: Pie
Sources Available: .pptx
Product ID: PC00699
Template incl.: 22 editable slides
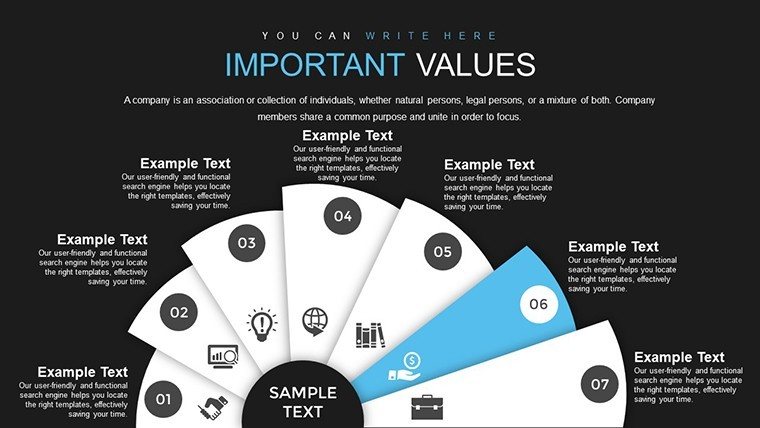
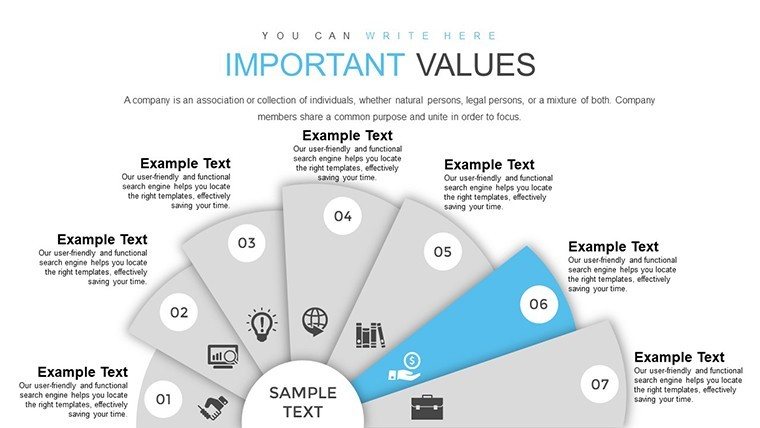
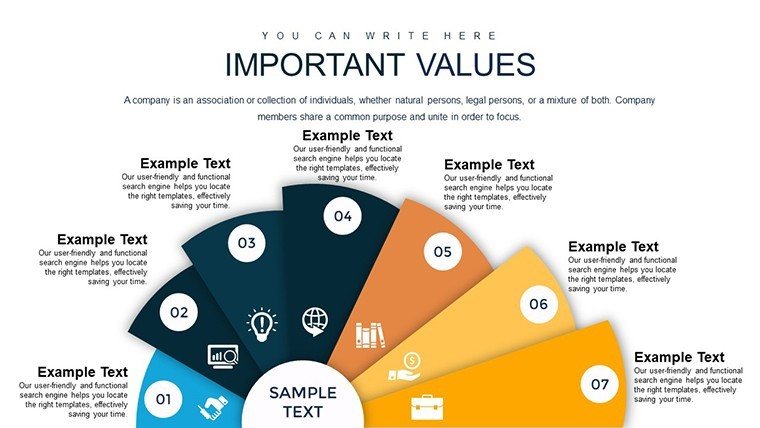
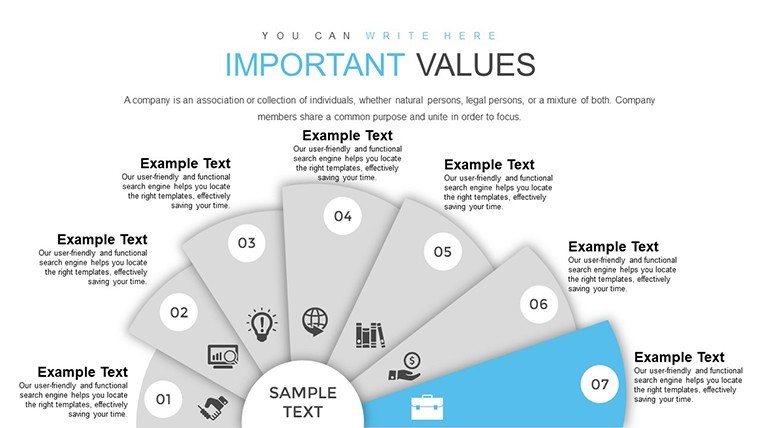
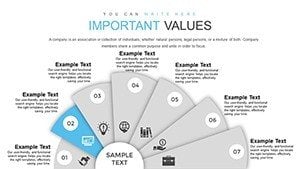
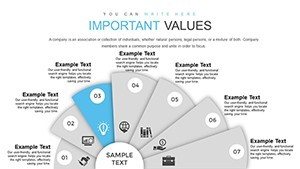
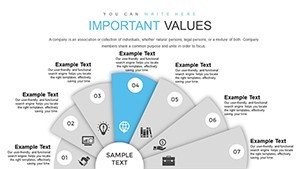
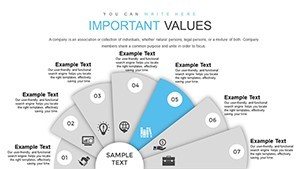
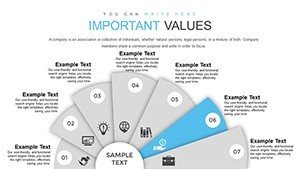
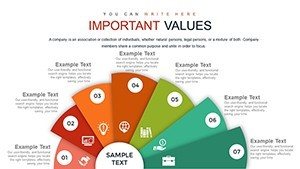
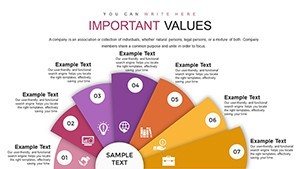
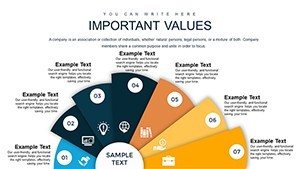
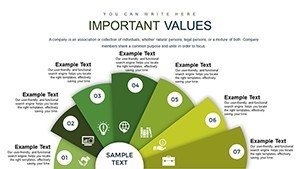
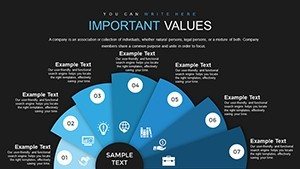
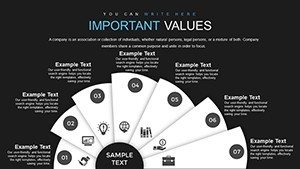
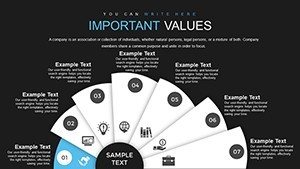
Step into a realm where data visualization meets artistic flair with the Fan Indicator PowerPoint Charts Template. This innovative tool is crafted for professionals who demand more from their presentations - more clarity, more engagement, and more impact. Featuring 22 meticulously designed editable slides, it specializes in fan-style indicators that radiate information outward, perfect for illustrating proportional data, performance metrics, or comparative analyses in a visually striking manner. Marketers unveiling campaign results or financial analysts dissecting revenue streams will find this template indispensable for turning numbers into narratives that captivate.
Picture this: In a high-pressure sales meeting, your fan chart unfolds like a blooming flower, each petal representing a market segment with precise data labels that pop against customizable backgrounds. This template isn't confined to rigid structures; its flexibility allows seamless data connections from multiple sources, ensuring your visuals are as dynamic as your insights. Compatible with both PowerPoint and Google Slides, it bridges the gap between creativity and functionality, enabling quick edits even on the go.
Exploring the Versatility of Fan Indicator Designs
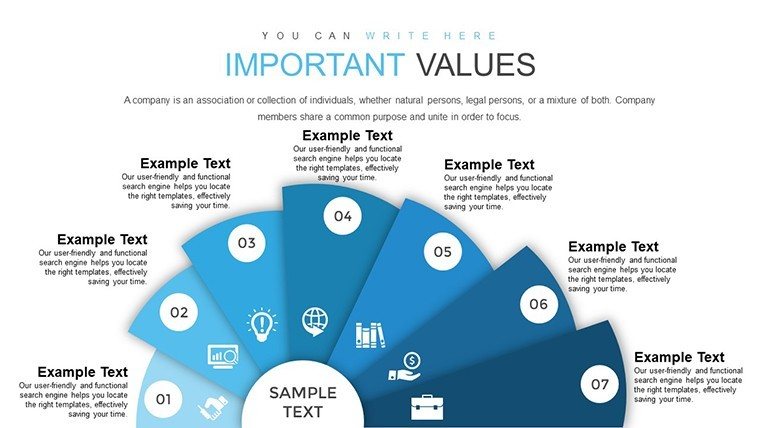
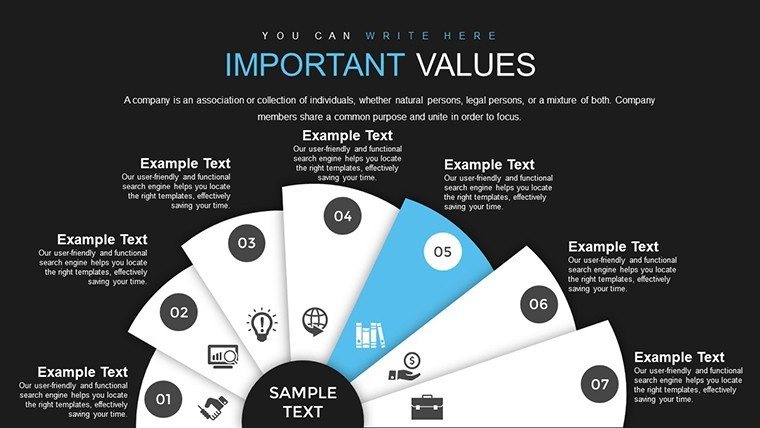
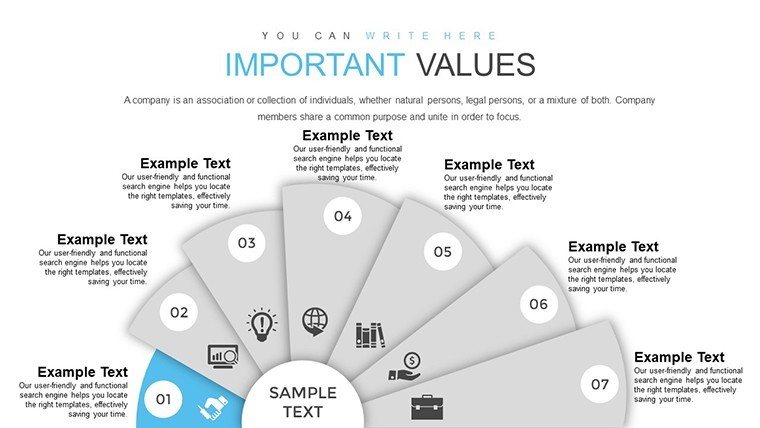
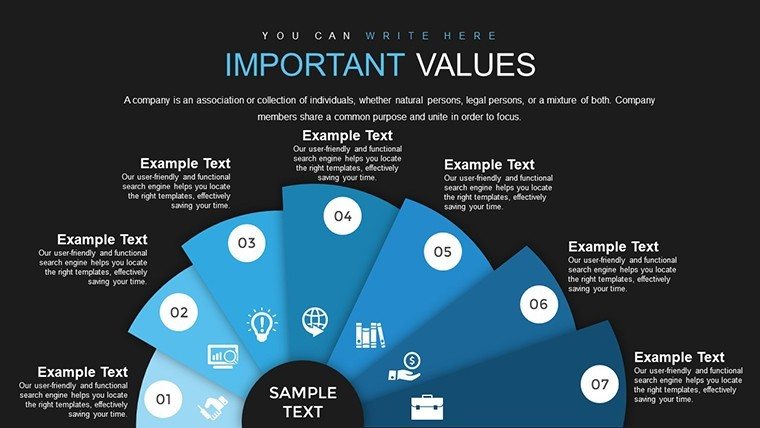
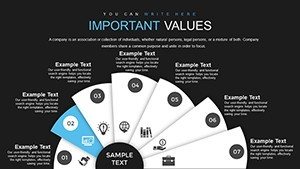
Fan indicators, akin to advanced pie charts, excel in displaying parts of a whole with a radial spread that draws the eye naturally. This template elevates them with options for circular petals, radar overlays, and segmented fans, allowing you to adapt to diverse data sets. Whether tracking customer satisfaction scores or budget allocations, these designs provide a fresh alternative to traditional graphs, enhancing comprehension through intuitive layouts.
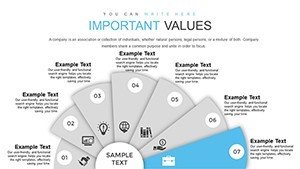
A standout example is Slide 7, which offers a multi-fan setup for comparative views, ideal for benchmarking against competitors. Users can drag and drop data points, instantly updating visuals without coding knowledge, drawing from user-centered design principles advocated by experts in the field.
Essential Features for Professional Excellence
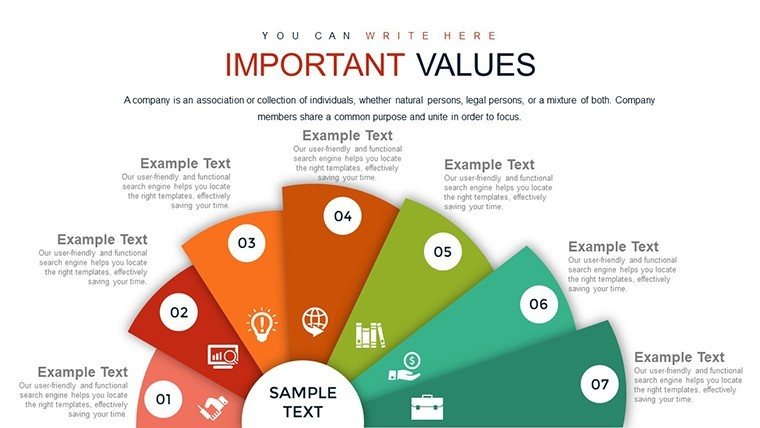
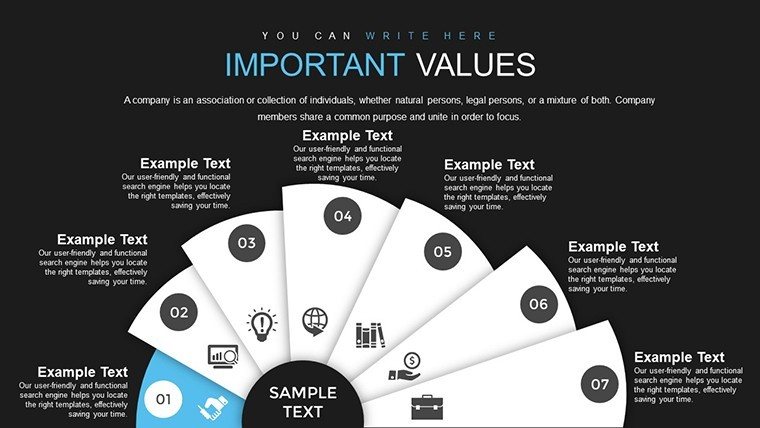
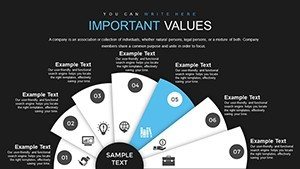
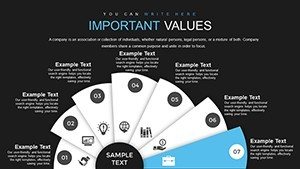
- Customizable Aesthetics: Alter colors, fonts, and sizes to embody your brand's essence, ensuring every slide feels bespoke.
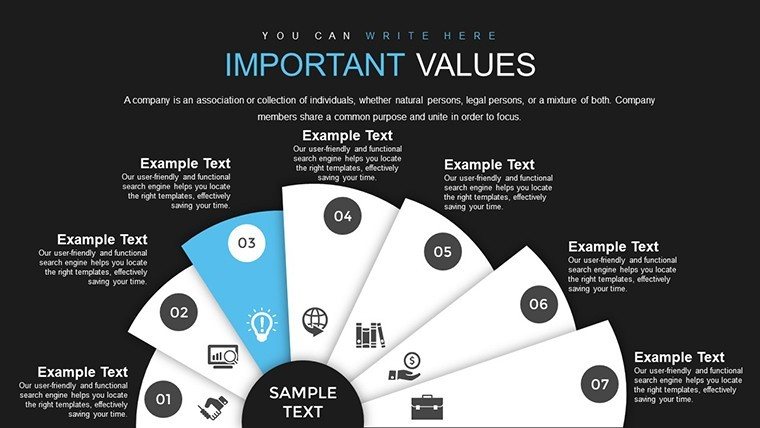
- Animated Elements: Engage audiences with smooth transitions that reveal data progressively, building suspense and focus.
- Data-Driven Flexibility: Connect to live sources for real-time updates, crucial in volatile markets like finance.
- High-Quality Resolution: Vector-based graphics scale perfectly, maintaining sharpness in any presentation setting.
- Legend and Label Tools: Intuitive interfaces for adding explanations, making complex info accessible.
These features are grounded in real-world needs, such as those seen in case studies from marketing firms where fan charts clarified consumer behavior patterns, leading to more targeted strategies.
Tailored Use Cases Across Industries
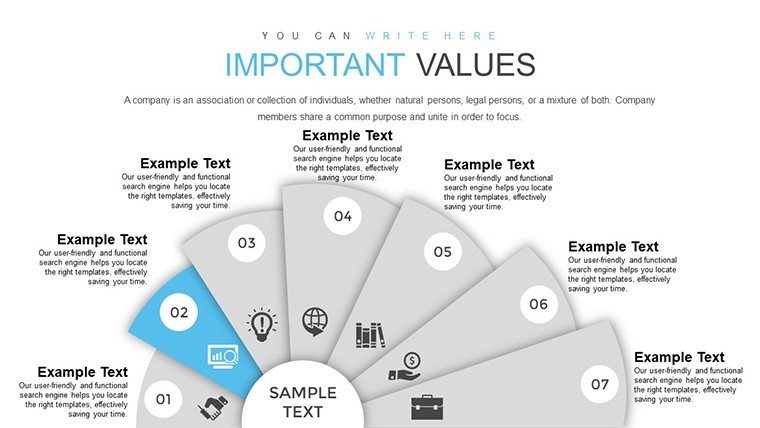
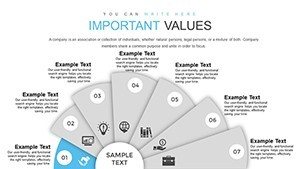
For marketing professionals, this template transforms raw campaign data into compelling stories. Slide 12's fan indicator can segment audience demographics, highlighting engagement levels with color-coded petals that make insights leap off the screen. This visual approach aligns with neuromarketing research, where radial designs improve recall by mimicking natural eye movement.
In finance, analysts use it for earnings reports. Consider a quarterly review where Slide 18 displays revenue streams in a fan format, allowing stakeholders to grasp proportions at a glance. This efficiency mirrors practices in top firms like Deloitte, where visual aids streamline decision-making.
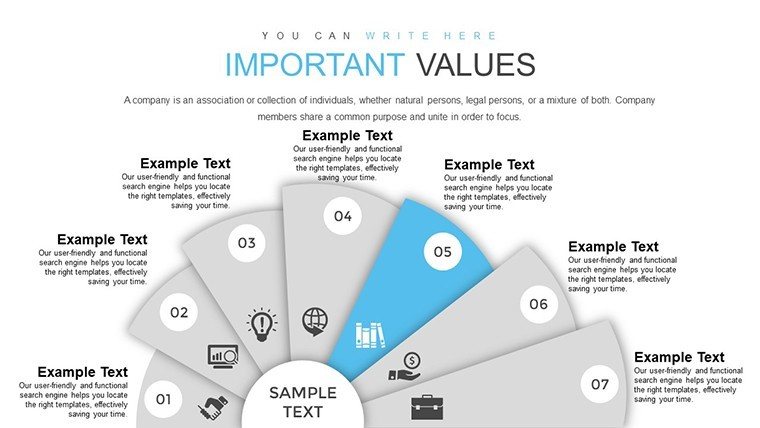
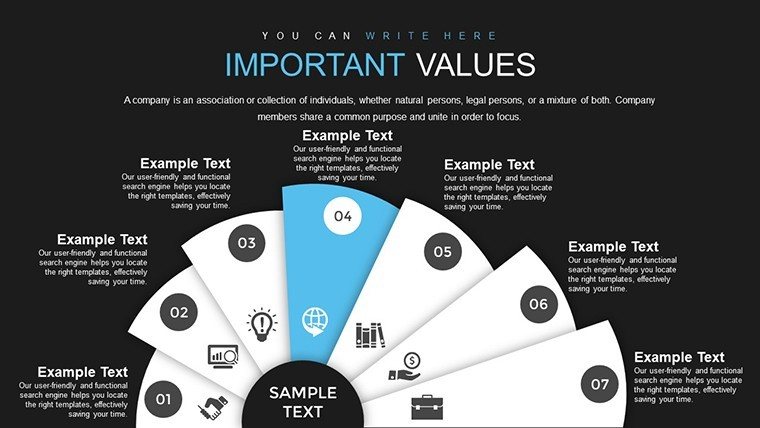
Educators and trainers benefit too, employing fan charts for subject breakdowns. In a business course, Slide 4 could illustrate market share distributions, fostering interactive discussions that deepen understanding.
Customizing Your Fan Charts: A Practical Workflow
- Choose Your Layout: Select from 22 slides based on your data's complexity and desired emphasis.
- Populate with Data: Import from Excel or input manually, watching the fan adjust automatically.
- Refine Visuals: Apply themes and animations via PowerPoint's built-in tools for a polished finish.
- Incorporate Feedback: Share drafts and iterate based on team input for optimal relevance.
- Deliver with Confidence: Use presenter notes to guide your narrative alongside the visuals.
This step-by-step process not only saves time but also empowers users to experiment, leading to innovative presentations that stand out in crowded fields.
Advantages Over Conventional Charting Methods
While standard pies can feel dated, fan indicators offer a modern twist with better space utilization and emphasis on key segments. This template surpasses basic options by including layered fans for multidimensional data, avoiding the clutter that plagues overcrowded visuals.
Comparatively, free alternatives often lack animation and compatibility, whereas this paid version ensures robustness, backed by user testimonials praising its role in securing client approvals through superior clarity.
Boosting Engagement Through Strategic Design
Engagement soars when visuals tell a story, and fan designs excel at this by creating a sense of expansion and inclusivity. In a product launch pitch, use Slide 9 to fan out feature benefits, drawing parallels to how Apple presentations use radial elements to mesmerize audiences.
To infuse inspiration, view your data as a fan unfolding possibilities - each blade a pathway to insight, encouraging viewers to explore deeper.
Expert Tips for Fan Indicator Mastery
- Opt for fewer segments: Limit to 5-7 for clarity, preventing visual overload.
- Use gradients wisely: Enhance depth without distracting from data.
- Pair with narratives: Complement charts with storytelling slides for context.
- Ensure accessibility: High-contrast colors for color-blind friendly designs.
- Iterate often: Test on small groups to refine impact before final use.
These strategies, drawn from design pros, integrate seamlessly with the template, turning good presentations into unforgettable ones.
Embrace the fan's expansive nature to broaden your presentation horizons, making every session a showcase of expertise.
Frequently Asked Questions
- What makes fan indicators different from pie charts?
- Fan indicators provide a radial spread for better emphasis on segments, offering more dynamic visuals than traditional pies.
- Can I animate individual fan segments?
- Yes, the template includes options to animate segments separately for phased reveals.
- Is drag-and-drop supported?
- Absolutely, enabling quick data adjustments without technical expertise.
- Does it work on older PowerPoint versions?
- Compatible with PowerPoint 2010 and later, plus Google Slides.
- Are there templates for specific industries?
- While general, customization allows tailoring to marketing, finance, or education needs.
- How do I handle large data sets?
- Use layered fans or summaries to maintain clarity without overwhelming the slide.