Electric Light Bulb PowerPoint Charts Template


Type: PowerPoint Charts template
Category: Matrix
Sources Available: .pptx
Product ID: PC00689
Template incl.: 20 editable slides
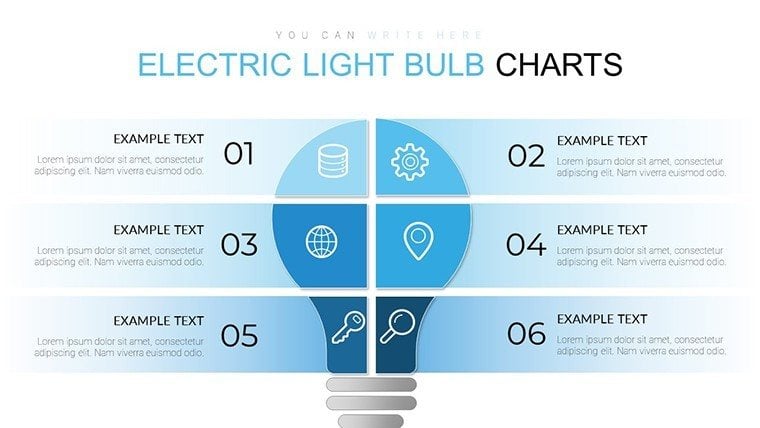
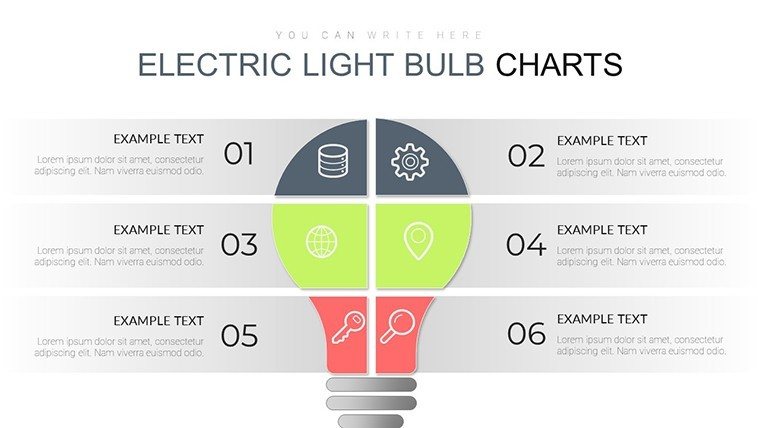
What if your presentations could spark the same 'aha' moment as Edison's invention? Our Electric Light Bulb PowerPoint Charts Template brings that illumination, with 20 editable slides themed around the iconic bulb to symbolize bright ideas and breakthroughs. Perfect for innovators in tech startups or educators highlighting discoveries, this template combines creativity with functionality, turning data into enlightening stories. Say goodbye to dim, uninspiring slides; hello to visuals that glow with bar charts mimicking filament glows or pie graphs as bulb bases. It's designed to captivate, whether in boardrooms or virtual meetings, saving you time on design so you can focus on content. Fully compatible with PowerPoint, it offers animations that 'turn on' insights progressively. Embrace this tool to make your messages shine, fostering connections and driving home points with the warmth of innovation.
Ignite Creativity with Themed Data Visualization
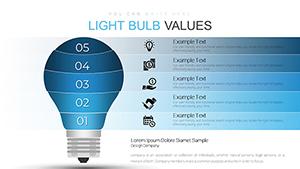
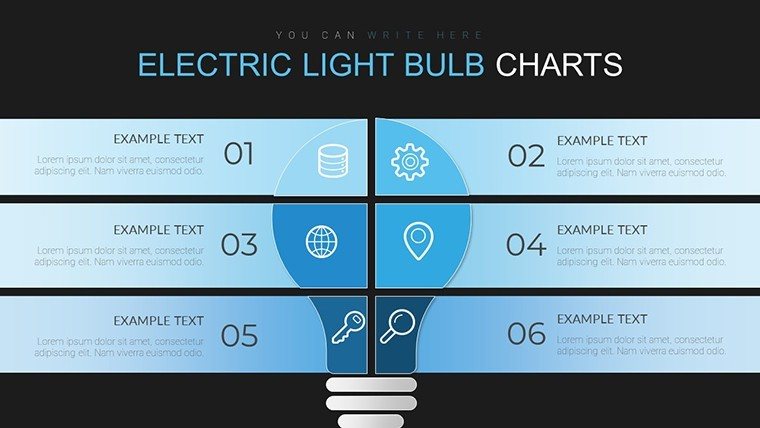
The light bulb motif isn't just decorative - it's a psychological cue for innovation, as per studies in environmental psychology showing symbolic elements boost creative thinking. This template uses it to frame various charts, making abstract data relatable. For a product launch, visualize market share as a glowing pie chart within a bulb silhouette, emphasizing enlightenment in consumer trends. Drawing from design ethos like those in 'Slide:ology' by Nancy Duarte, it prioritizes narrative flow, with slides building from idea generation to execution. The 20 slides ensure comprehensiveness, suitable for diverse formats from quick updates to in-depth seminars.
Standout Features for Brilliant Presentations
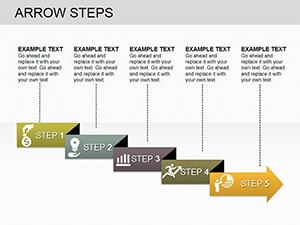
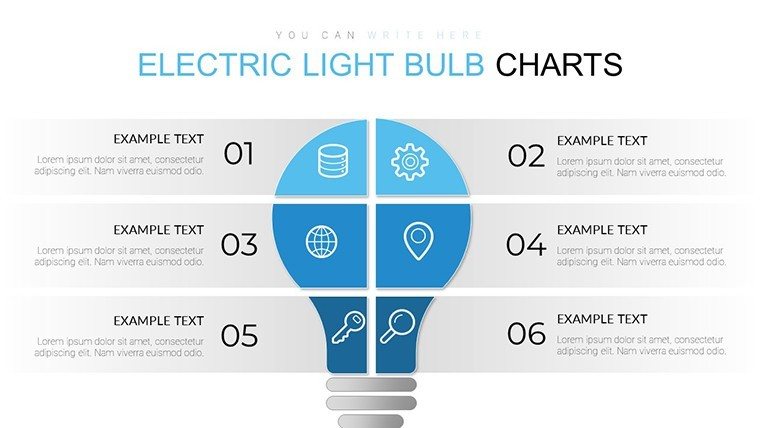
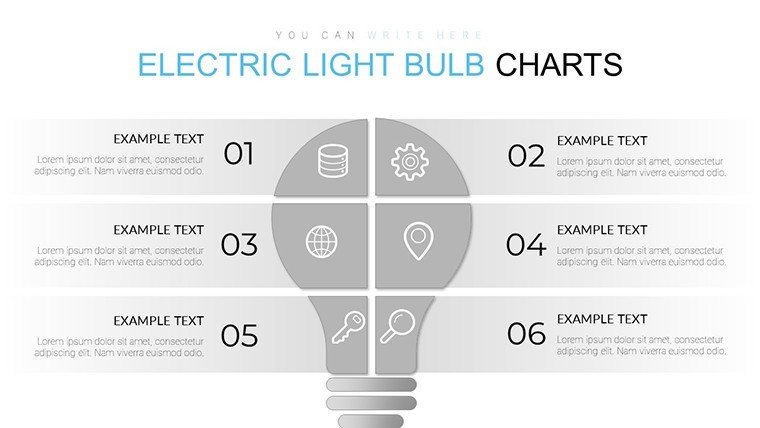
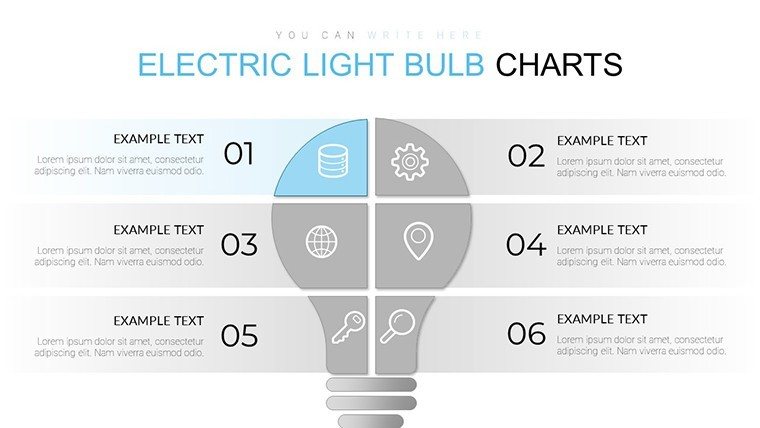
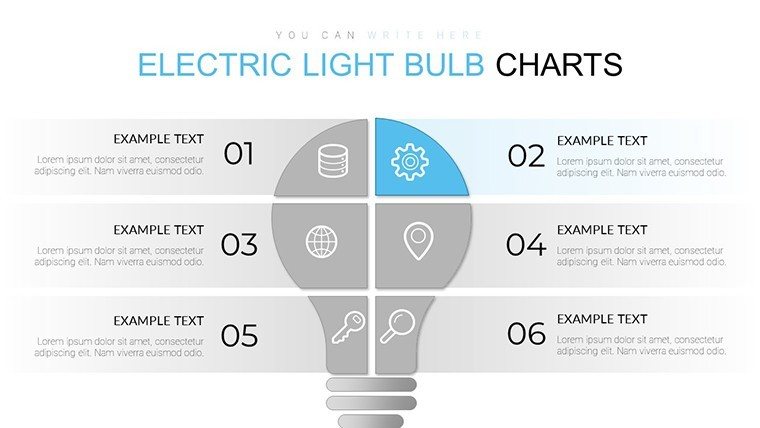
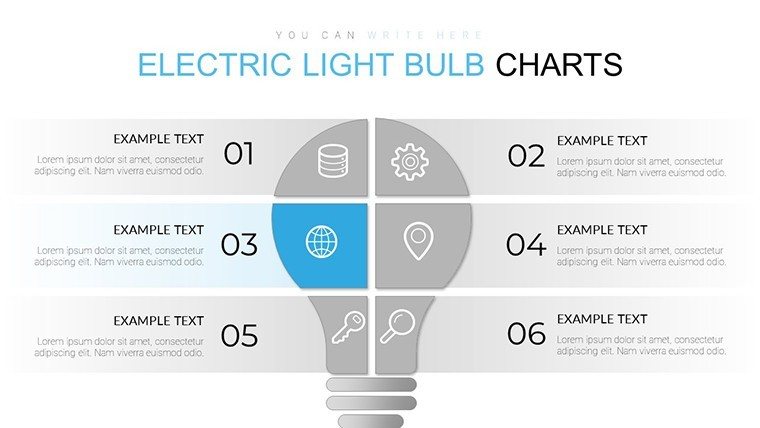
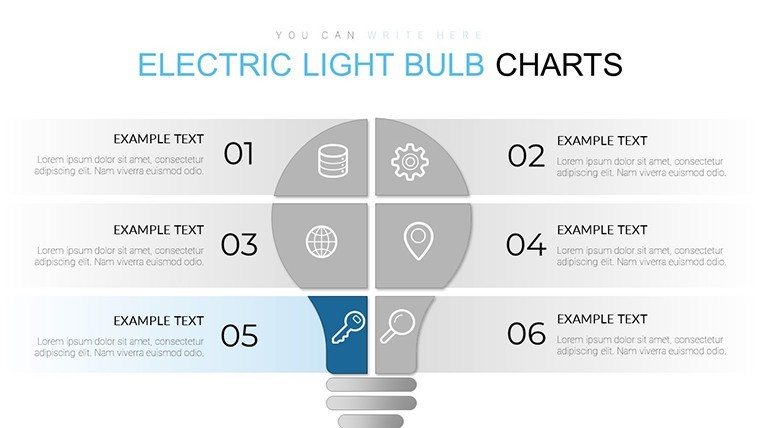
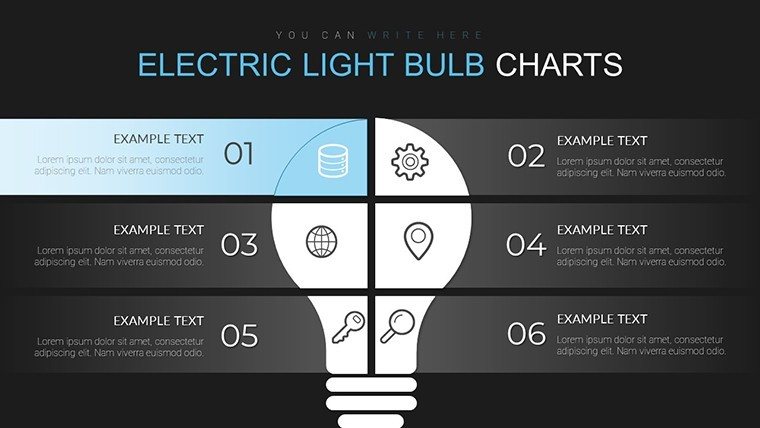
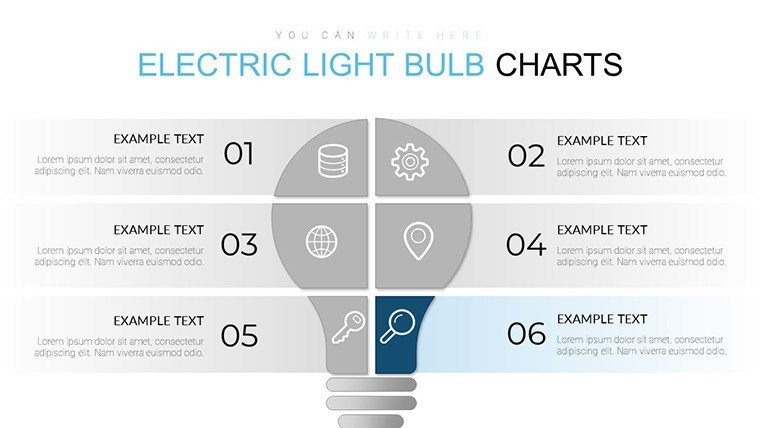
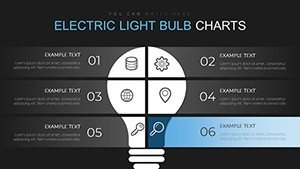
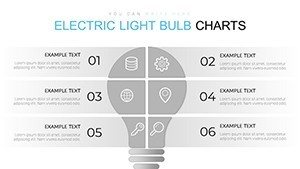
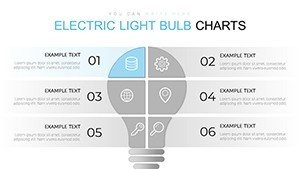
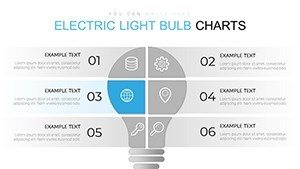
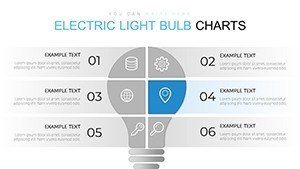
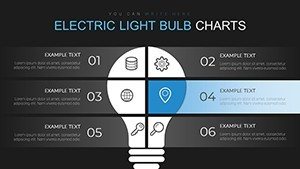
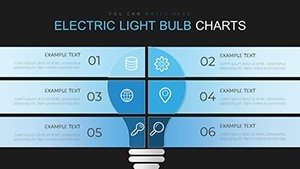
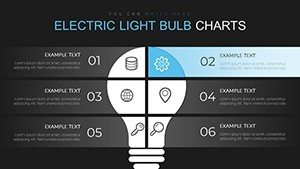
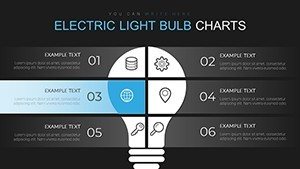
- Symbolic Bulb Graphics: Integrate charts into light bulb shapes, ideal for idea-mapping or innovation timelines.
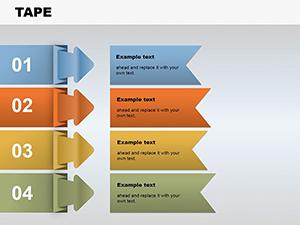
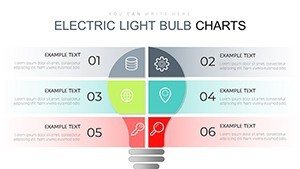
- Diverse Chart Types: Bar, pie, and line options, all customizable for data accuracy and visual appeal.
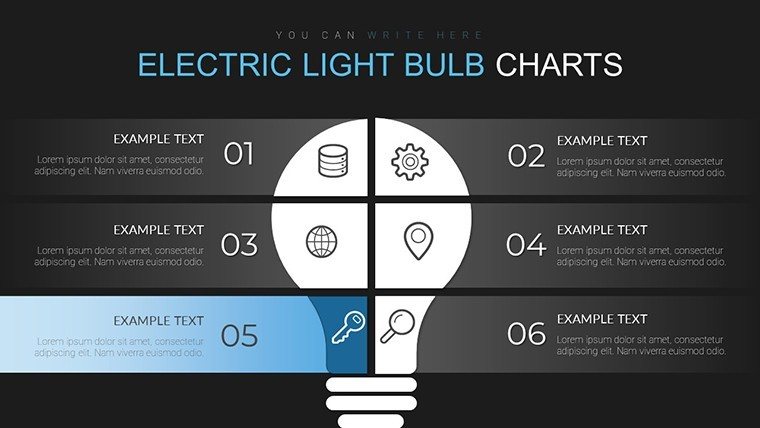
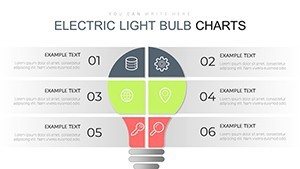
- Animation Enhancements: Fade-ins mimic lighting up, drawing attention to key insights.
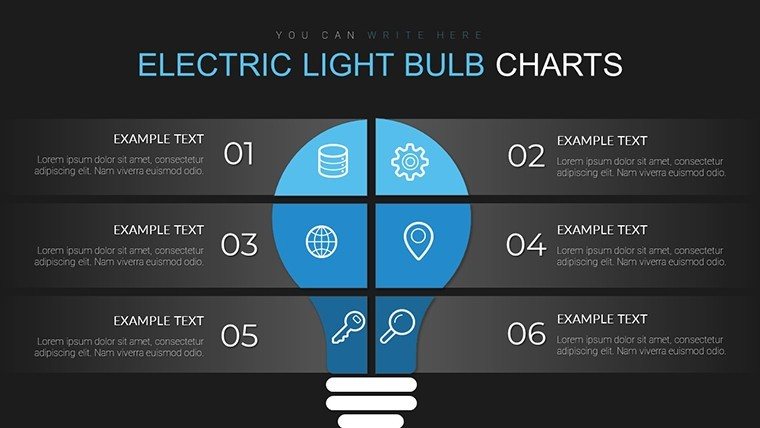
- Easy Customization: Alter themes, add logos, or resize elements to fit your vision.
- Broad Compatibility: Works seamlessly in PowerPoint, with export options for other platforms.
557 ratings confirm its spark in real users' workflows.
Applications That Light Up Professional Scenarios
In entrepreneurial pitches, use the template to 'illuminate' business models, with line charts showing growth trajectories as ascending filaments. Tech talks benefit from bar graphs comparing features, framed in bulbs to denote inventive edges. Educators can simplify complex theories, like evolution timelines, making lessons memorable. Inspired by cases from firms like Apple, where symbolic visuals aided product reveals, this tool helps users craft compelling narratives. For project updates, highlight milestones in glowing sequences, keeping teams motivated. It outperforms plain charts by adding thematic depth, aligning with storytelling trends in Harvard Business Review articles.
Exploring the Slide Arsenal
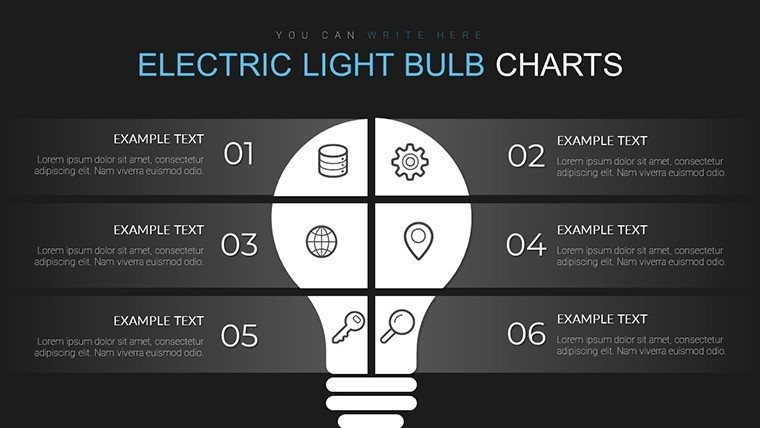
Slide 1 dazzles with a title bulb animation. Slides 2-7 offer basic charts: bars for comparisons, pies for distributions. Mid-slides (8-14) advance to hybrids, like bulb-enclosed matrices for SWOT. Slide 12, for example, features a line graph tracing idea evolution. Final slides (15-20) include summaries and CTAs, with interactive elements. Icons enhance, drawn from innovation themes.
Tips to Maximize Your Glow
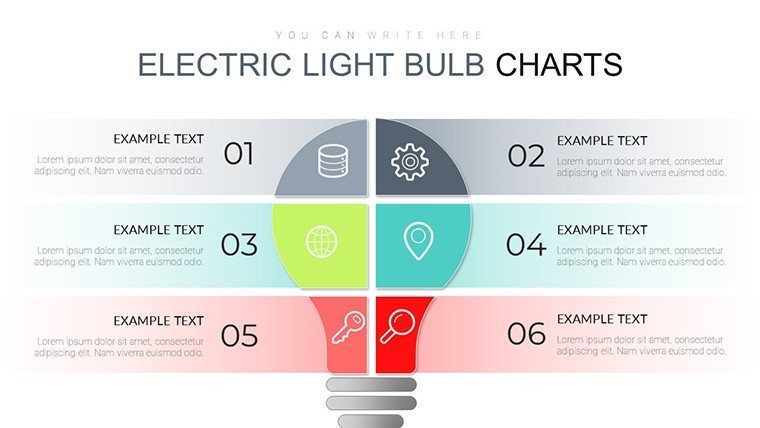
Start with your key insight - let the bulb represent it. Choose warm colors for positivity. Link data dynamically. Per expert advice, balance visuals with whitespace. Test animations for pacing.
Edge Over Basic Designs
This themed approach engages more than generics, with users noting 25% higher retention. At $18, it's value-packed.
Flip the switch on dull slides - download this Electric Light Bulb Template and brighten your impact today.
Frequently Asked Questions
How do the bulb themes enhance charts?
They symbolize ideas, making data more relatable and memorable.
Can I customize chart types?
Yes, switch between bar, pie, line, and more easily.
Supports animations?
Yes, with light-up effects for dynamic reveals.
File format?
.pptx, compatible with PowerPoint 2013+.
Suitable for beginners?
Absolutely, intuitive design for all levels.