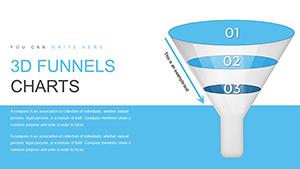
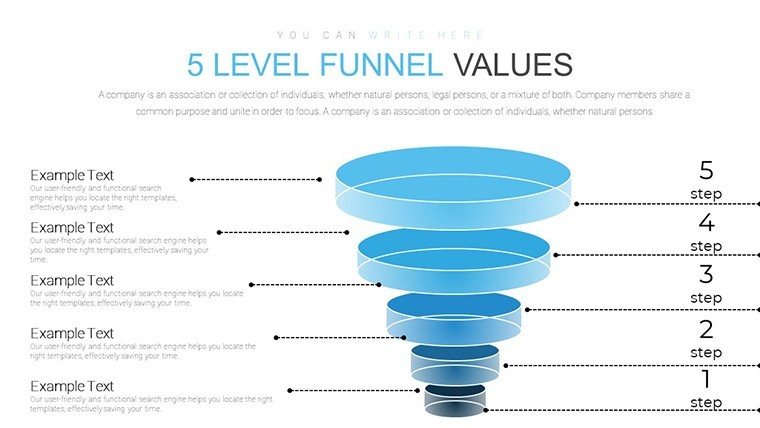
5-Level Funnel PowerPoint Charts: Boost Sales Pitches


Type: PowerPoint Charts template
Category: Flow
Sources Available: .pptx
Product ID: PC00661
Template incl.: 12 editable slides
In the fast-paced world of marketing and sales, capturing your audience's attention and guiding them through complex processes is crucial. Imagine presenting your sales pipeline or customer journey with visually striking 5-level funnel charts that not only clarify data but also inspire action. Our 5-Level Funnels Values PowerPoint Charts Template is designed precisely for professionals like you - marketing gurus, sales experts, and business strategists - who need to communicate strategies effectively. With 12 fully editable slides, this template offers a blend of sleek, modern designs and vibrant, creative options, ensuring your presentations stand out. Whether you're pitching to clients, updating stakeholders, or training teams, these funnel charts turn raw metrics into meaningful narratives, highlighting progression stages with precision and flair. Tailored for seamless compatibility with PowerPoint and Google Slides, it saves you hours of design time while enhancing your professional edge. Dive into a tool that adapts to your branding, boosts engagement, and ultimately drives conversions - because in business, every slide counts toward closing the deal.
Tailored Features for Dynamic Presentations
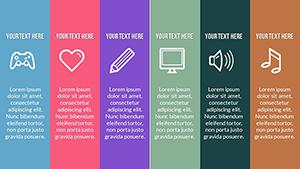
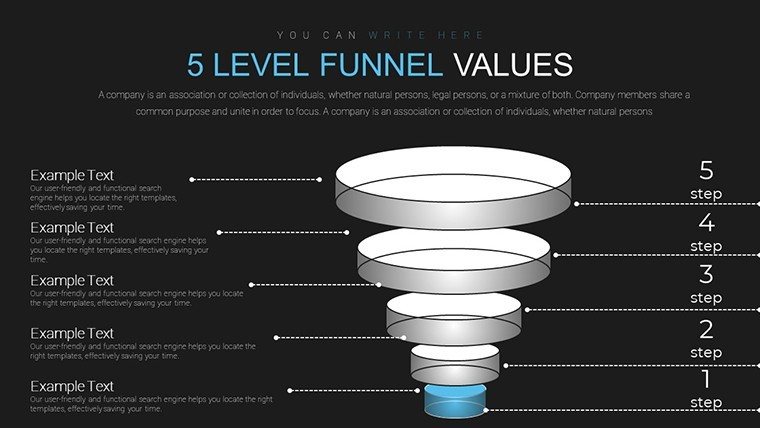
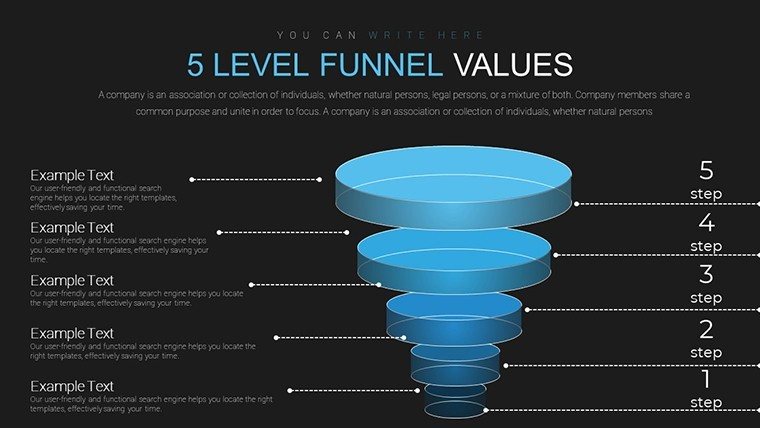
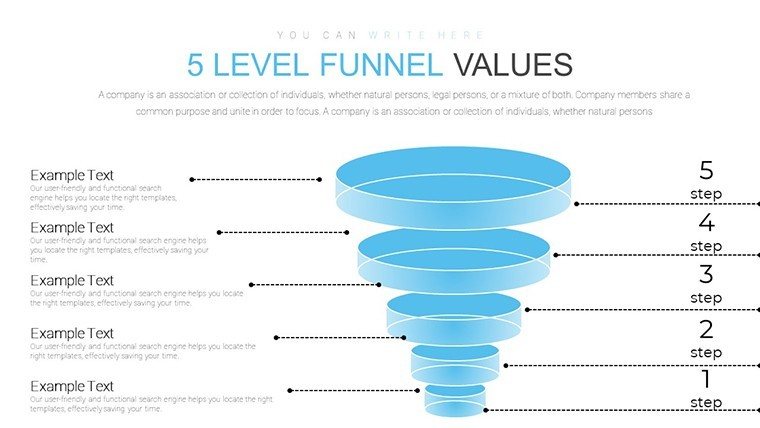
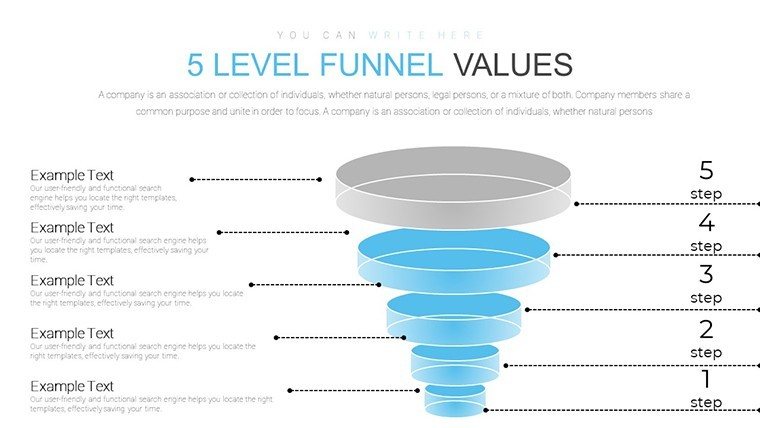
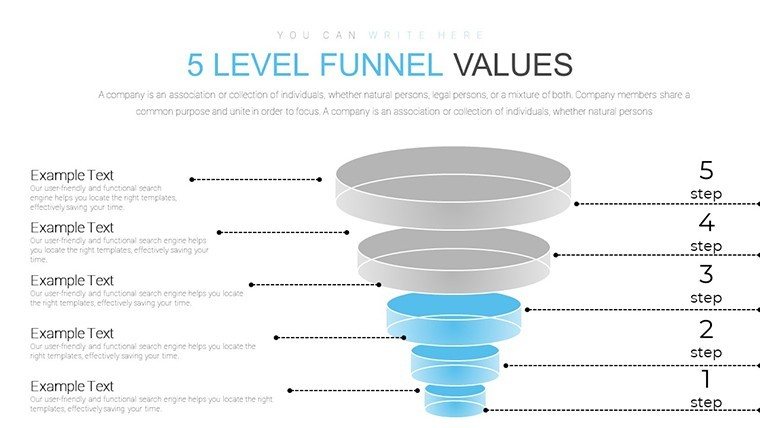
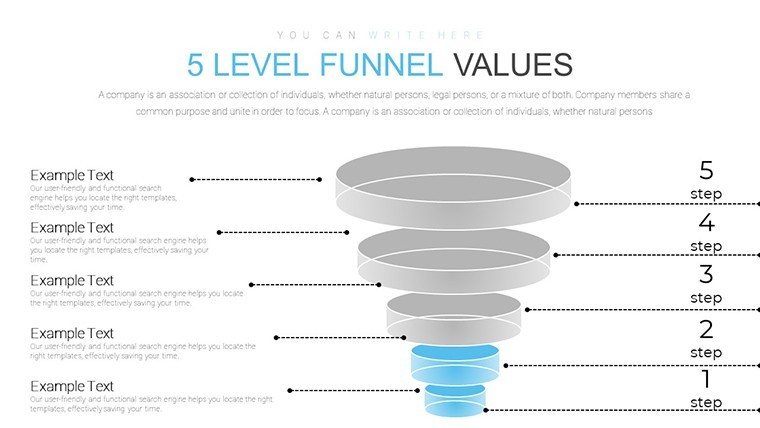
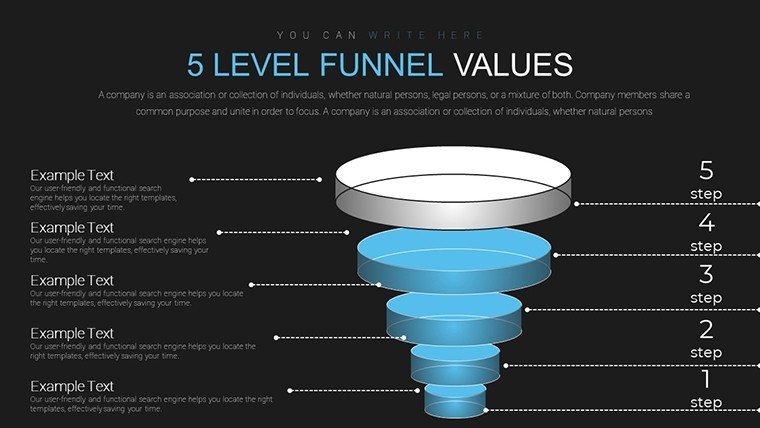
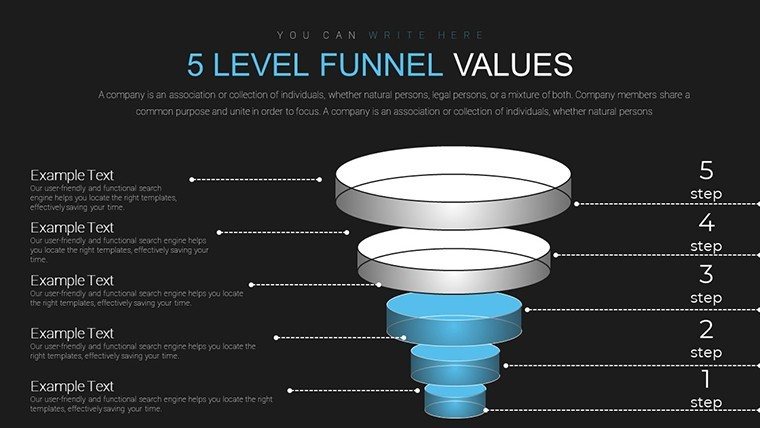
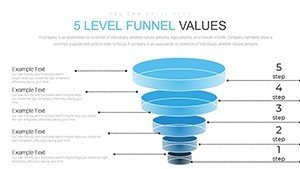
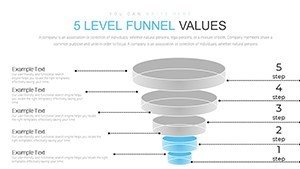
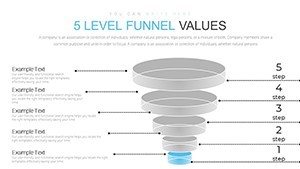
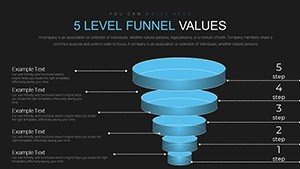
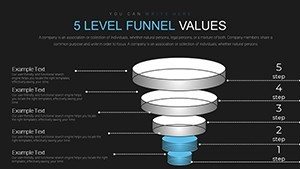
This template isn't just about visuals; it's about empowerment. Each of the 12 slides is crafted with high-resolution graphics that maintain quality across devices. You'll find customizable elements like color schemes, fonts, and icons that align with your company's identity. For instance, adjust the funnel levels to represent stages in a sales process: awareness, interest, decision, action, and loyalty. The designs range from minimalist black-and-white for corporate boardrooms to colorful gradients for creative pitches, ensuring versatility across occasions.
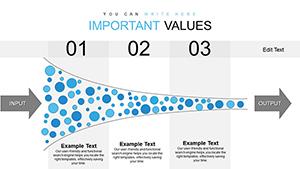
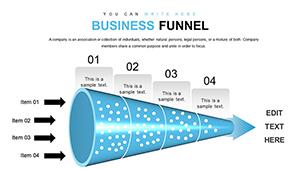
- Editable Funnel Structures: Easily modify shapes and values to fit your data, such as percentage drops or value additions at each level.
- Integrated Icons and Labels: Pre-built with thematic icons for quick customization, reducing setup time.
- Data-Driven Animations: Optional animations that reveal levels progressively, keeping audiences hooked.
- High-Contrast Options: For accessibility, ensuring compliance with standards like WCAG for inclusive presentations.
These features draw from best practices in data visualization, inspired by experts like Edward Tufte, who emphasized clarity over clutter. By incorporating such principles, your funnels not only display data but tell a story that resonates.
Real-World Applications and Benefits
Picture this: You're an entrepreneur launching a startup pitch. Using our 5-level funnel charts, you illustrate your customer acquisition strategy, showing how leads convert to loyal customers. This visual aid has helped firms like those in the SaaS industry increase investor interest by up to 30%, according to case studies from Harvard Business Review. For educators, these charts simplify teaching marketing funnels, making abstract concepts tangible for students.
The benefits extend beyond aesthetics. Professionals report saving 50% more time on slide creation, allowing focus on content delivery. In sales environments, these charts enhance persuasion - think of a real estate firm using them to map client journeys from inquiry to closing, aligning with AIA standards for project management visuals in architecture-related pitches. The template's flow category integration means it's ideal for process-oriented industries, where sequential data visualization is key.
- Marketing Campaigns: Track campaign performance from reach to conversion.
- Sales Training: Demonstrate pipeline management to new teams.
- Business Strategy Sessions: Visualize growth models for executive reviews.
Compared to basic PowerPoint tools, our template offers pre-optimized layouts that avoid common pitfalls like overcrowded slides, ensuring your message shines through.
Step-by-Step Customization Guide
Getting started is effortless. Download the .pptx file and open it in PowerPoint. Select a slide, input your data via the intuitive placeholders, and tweak visuals using the built-in editor. For advanced users, integrate with tools like Excel for live data linking, creating dynamic updates. Add your logo in seconds, and preview animations to fine-tune pacing. This workflow mirrors professional design processes, as seen in agencies following Adobe's creative standards, ensuring polished results every time.
Tips for maximum impact: Use contrasting colors for each funnel level to denote progression, incorporate real-time data for live demos, and pair with storytelling narratives. Avoid overloading with text - let the visuals lead. In architecture pitches, for example, adapt funnels to show project phases from concept to completion, enhancing client understanding and buy-in.
Elevate Your Professional Presence
As a seasoned executive or budding entrepreneur, you know that compelling visuals can make or break a presentation. This template equips you with tools trusted by industry leaders, fostering trust and authority. Its editable nature ensures longevity - update for new campaigns without starting over. Ready to transform your data into persuasive power? Customize this 5-level funnel template today and watch your presentations soar.
Frequently Asked Questions
- How customizable are the funnel charts?
- Fully editable - you can change colors, sizes, labels, and even add or remove levels to suit your needs.
- Is this compatible with Google Slides?
- Yes, upload the .pptx file directly to Google Slides for seamless editing and collaboration.
- What file formats are available?
- Primarily .pptx, with options for export to PDF or images post-customization.
- Can I use this for commercial purposes?
- Absolutely, ideal for business pitches, with no restrictions on professional use.
- How do I integrate data from Excel?
- Copy-paste values or use PowerPoint's data linking feature for dynamic charts.