Free Thinking Charts PowerPoint Template: Innovate


Type: PowerPoint Charts template
Category: Free Templates, Illustrations
Sources Available: .pptx
Product ID: PC00651
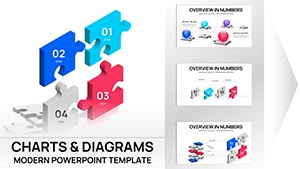
Template incl.: 24 editable slides
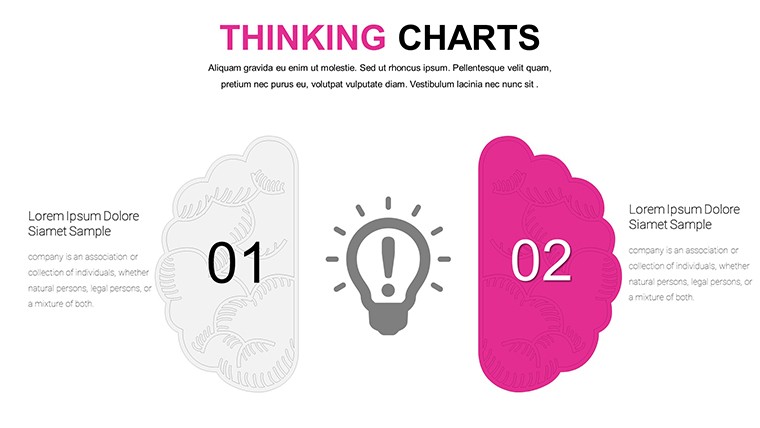
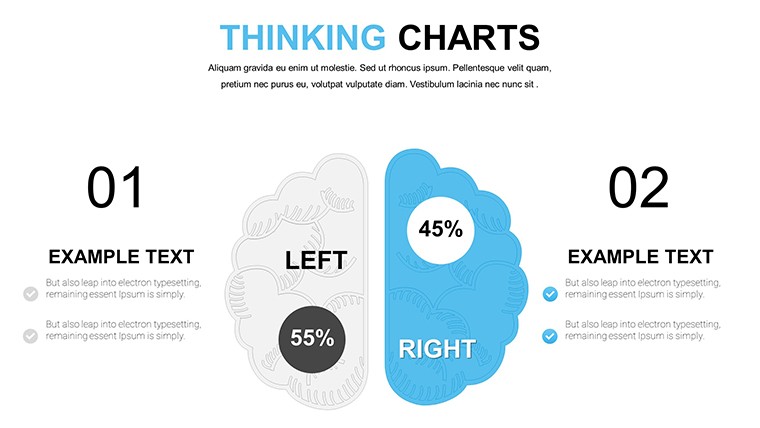
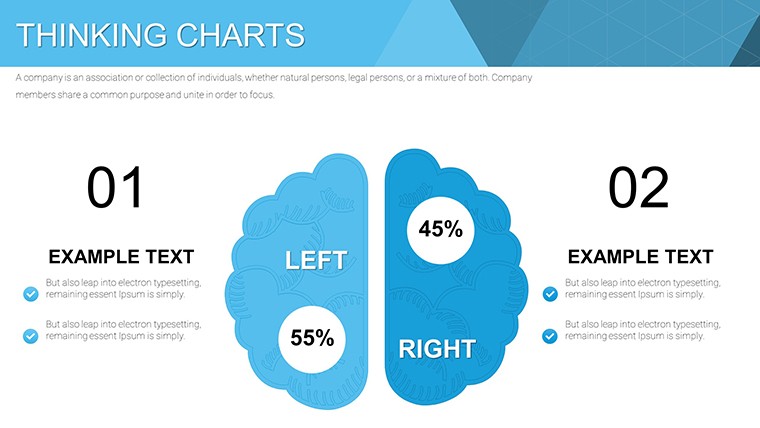
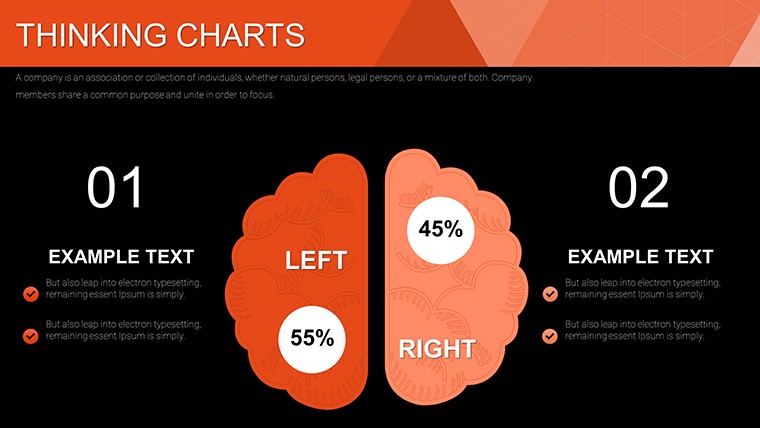
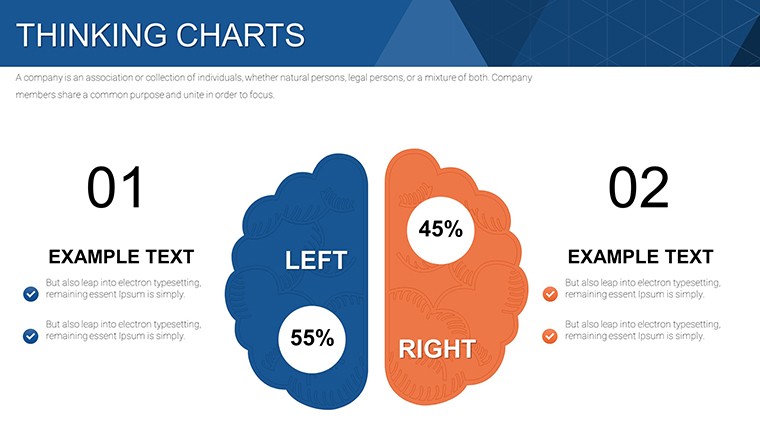
Unlock the power of ideas with our Free Thinking PowerPoint Charts Template, designed to fuel critical analysis and creative problem-solving. Featuring 24 editable slides, this resource is a boon for educators fostering classroom discussions, business pros tackling complex challenges, and anyone seeking to visualize thoughts clearly. In a world brimming with information, this template helps distill chaos into coherence, turning abstract concepts into actionable insights.
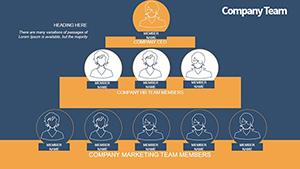
Envision a workshop where mind maps branch out like neural pathways, mirroring how critical thinking diagrams - such as those in graphic organizers - enhance cognitive skills. Drawing from educational strategies, it promotes deeper understanding, much like Slidesgo's critical thinking lesson templates that engage audiences with editable graphics.
Essential Features for Creative Flow
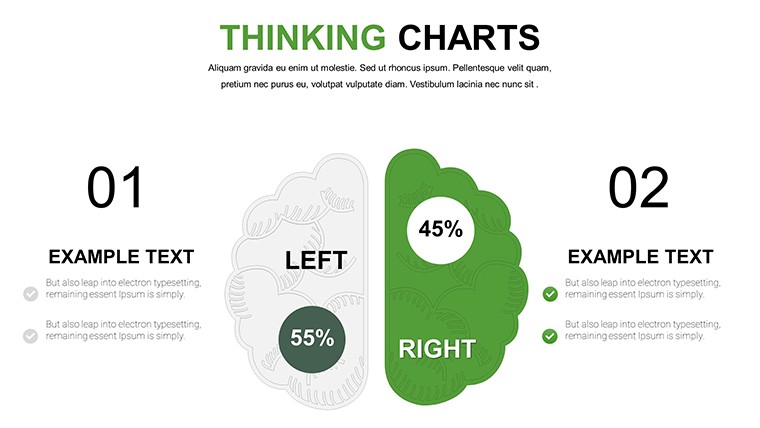
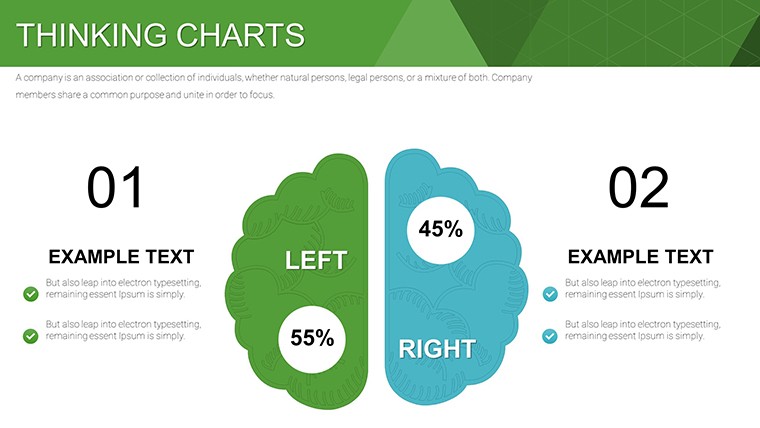
At its heart, the template offers versatile charts that adapt to your vision. High-fidelity designs ensure professional polish, with easy edits for colors, sizes, and content. Unlike rigid templates, this one encourages experimentation, aligning with storytelling with data principles where explanations clarify graph skeletons.
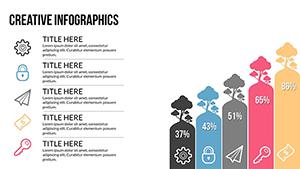
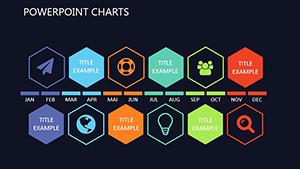
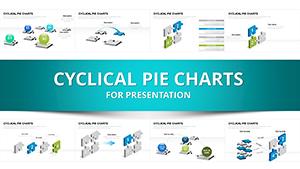
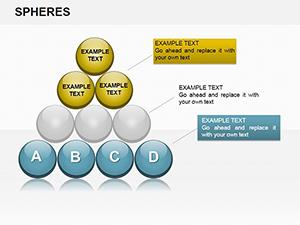
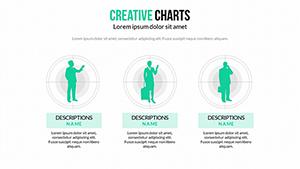
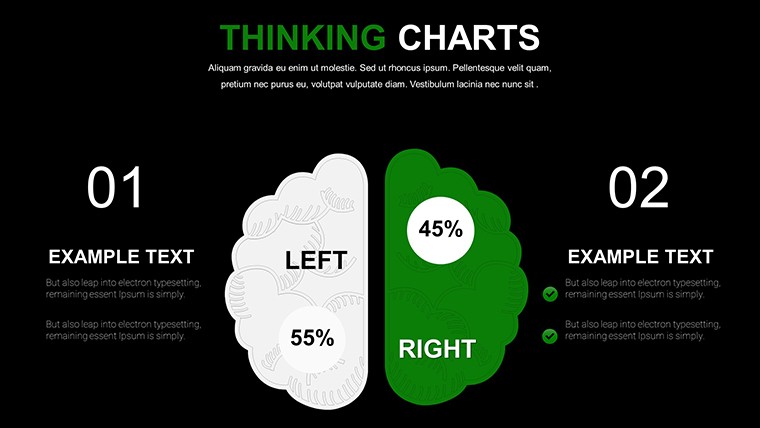
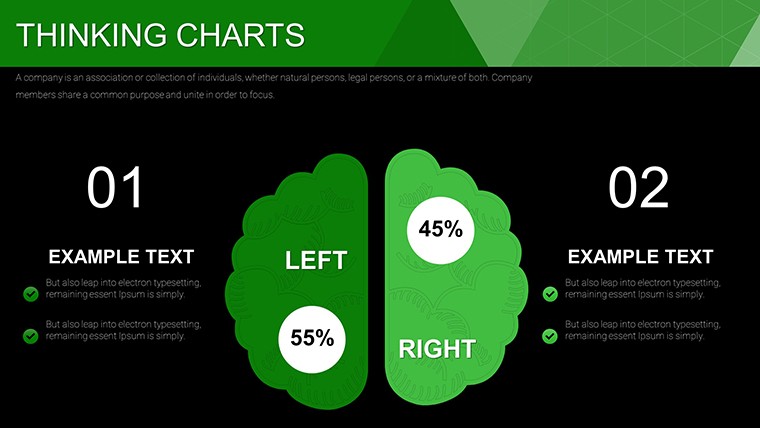
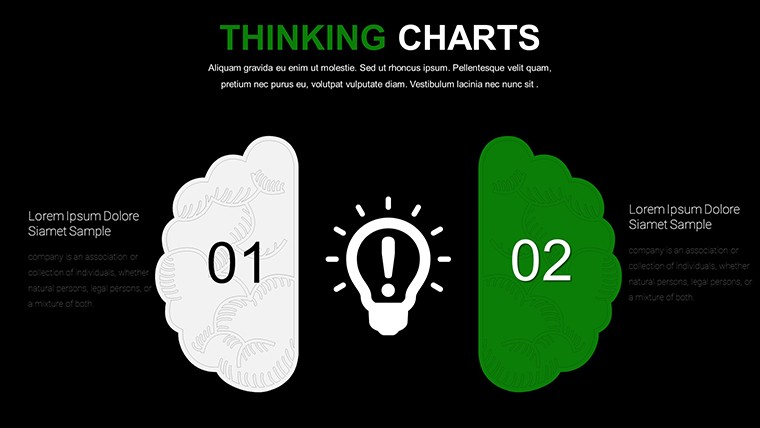
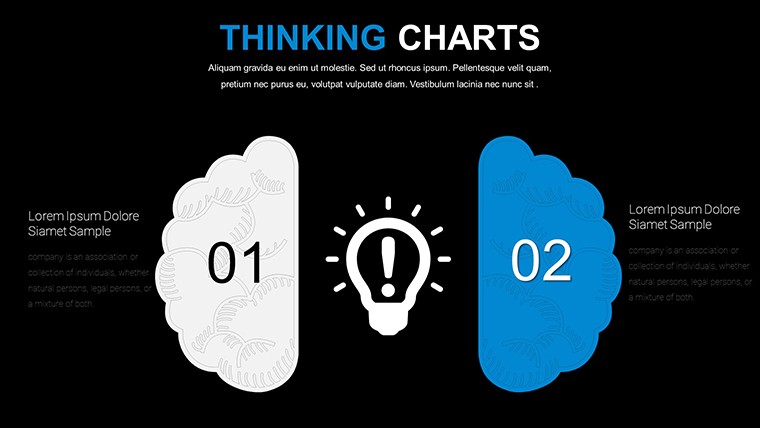
- Diverse Diagram Types: Bar charts, pie graphs, flowcharts, and mind maps for multifaceted presentations.
- User-Centric Design: Intuitive interfaces that let you focus on ideas, not formatting.
- Instructional Aids: Built-in guides to maximize each slide's potential.
- Versatile Compatibility: Works flawlessly in PowerPoint and beyond.
These elements are rooted in critical thinking frameworks, similar to those in SlideTeam's top 10 examples, providing a canvas for innovative expression.
Practical Use Cases in Action
For corporate reports, use flowcharts to map decision trees, echoing how consultants impress with data visualizations. In academia, pie charts break down concepts, boosting engagement as per ATD's graphic organizers for skill development.
Real examples include using line charts for trends, as in Dave Paradi's critical interpretation videos, ensuring accurate messages. This template facilitates such precision, turning data into narratives that resonate.
Consultants can leverage it for client sessions, visualizing insights with treemaps or heatmaps from ThoughtSpot's chart types, fostering informed debates.
Step-by-Step Implementation
- Download Freely: Access without barriers and open in your preferred tool.
- Customize Content: Insert your data into charts, adjusting for style.
- Add Depth: Incorporate metadata and highlights for emphasis.
- Present Dynamically: Use transitions to guide audience focus.
- Refine Iteratively: Gather feedback and tweak for perfection.
This method outperforms basic slides by embedding critical thinking, as in LinkedIn advice on data viz.
Amplifying Impact Through Expertise
The template's value lies in promoting clarity and efficiency, with users noting enhanced audience interaction. Inspired by YouTube's visualization for critical thinking, it cultivates skills through practical application.
Incorporate case studies: educators using dynamic resources to explain charts, leading to better comprehension. For pros, it's about time-saving layouts that allow content focus.
SlideGeeks' puzzles and time management templates complement this, offering a holistic approach to critical presentations.
Pro Tips for Enhanced Creativity
Balance visuals - use color sparingly for impact. Pair with verbal explanations for full storytelling. In group settings, collaborate in real-time for collective insights.
Extend to digital platforms: Share as interactive PDFs or embed in blogs for wider reach.
Dive into this Free Thinking Template and ignite innovation in your next session.
Frequently Asked Questions
How many chart types are included?
Multiple, including bars, pies, and flowcharts for diverse needs.
Is it truly free?
Yes, download without cost for unlimited use.
Can I add my own graphics?
Absolutely, editable features allow custom integrations.
Suitable for beginners?
Yes, with guides to ease the learning curve.
How to ensure data accuracy?
Use critical thinking to verify visuals match messages.