 Click to zoom
Work Experience PowerPoint Charts: Resume Boost
| Format | .pptx |
| Slides | 6 unique layouts |
| Aspect ratio | 16:9 |
| Compatibility | PowerPoint |
| Animated | No |
| Language | English |
| License | Commercial |
| File size | — |
| Version | v1.0 |
| Last updated | June 2024 |
What's inside
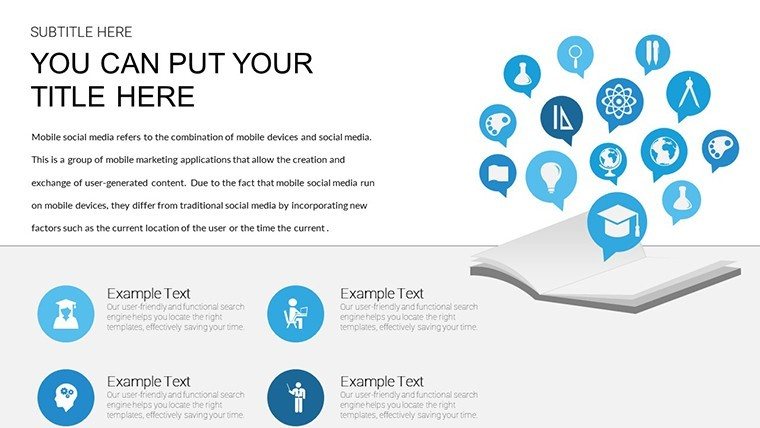
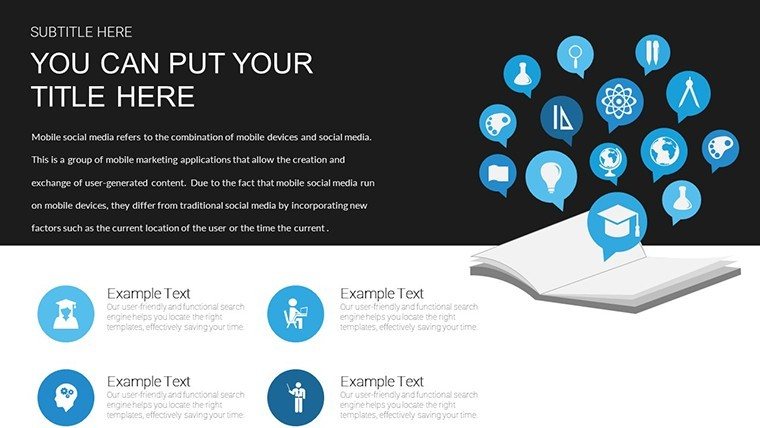
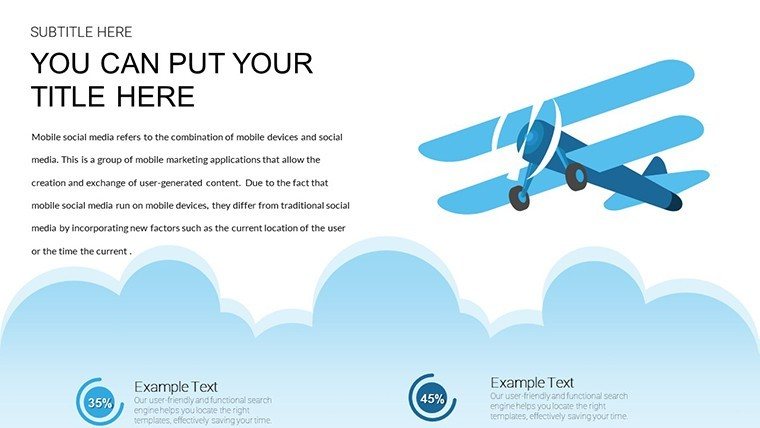
Navigate your professional narrative with confidence using our Work Experience PowerPoint Charts Template. Comprising 6 editable slides, it's engineered for job seekers, consultants, and educators to showcase career milestones vividly. In an era where visual resumes capture attention faster than text-heavy CVs, this template bridges the gap, turning your history into a compelling story that impresses recruiters and clients alike.
Think of it as your career's storyboard: timelines charting progress, bars quantifying achievements, much like the visual resumes on SlideTeam that timeline work experiences for impact.
Core Features for Professional Polish
The template's strength is its adaptability, with charts that mold to your story. Crisp visuals and customizable elements ensure your unique path shines through, far surpassing generic resumes.
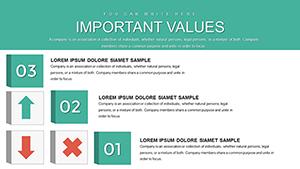
- Varied Chart Options: Bar graphs for skills, scatter plots for growth, Gantt for projects.
- Easy Customization: Tailor to branding with effortless edits.
- Seamless Integration: Compatible with PowerPoint for smooth use.
- Time-Saving Design: Quick setup to focus on content.
These draw from best practices in visual CVs, as in AIPPT's guides for creating standout profiles.
Tailored Applications and Examples
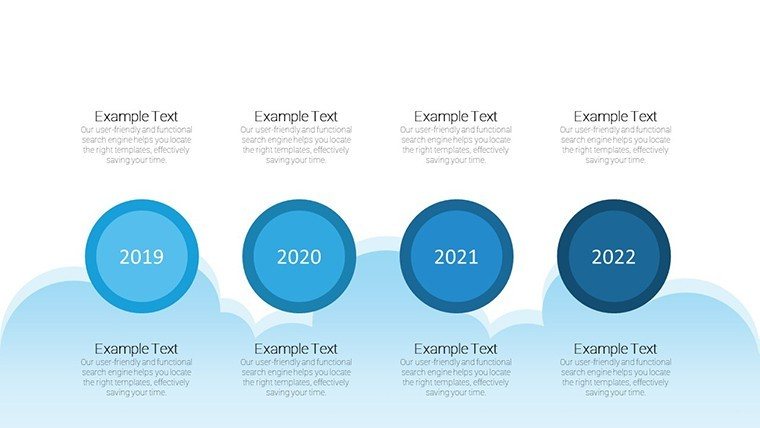
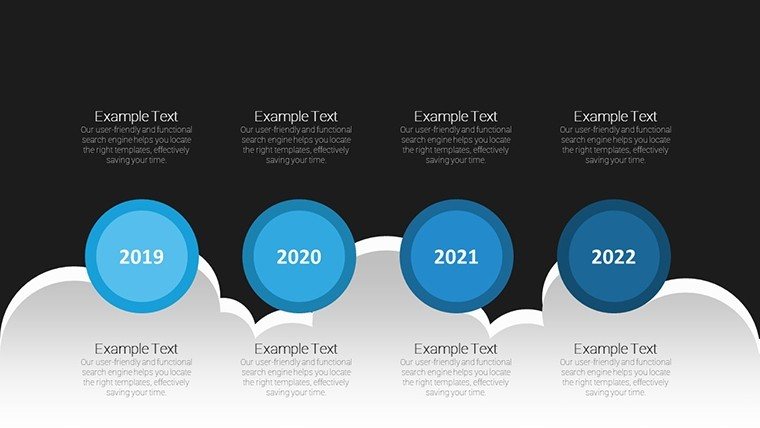
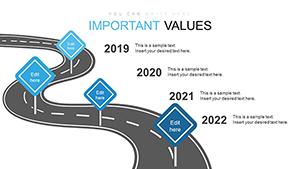
For sales pros, visualize revenue growth in presentations, highlighting accomplishments like in VisualCV examples. Project managers can depict timelines with Gantt charts, showing milestones clearly.
Inspiring from Careersherpa's visual resumes on Slideshare, use it to supplement traditional CVs, making your application memorable.
Educators craft teaching portfolios, charting experience in engaging formats.
Guide to Crafting Your Story
- Outline Journey: Map key roles and achievements.
- Input Details: Populate charts with specifics.
- Visualize Impact: Add colors and icons for emphasis.
- Refine Presentation: Ensure flow for coherence.
- Deliver Confidently: Use in interviews or pitches.
This outperforms text by engaging visually, as per FPPT's skill showcases.
Delivering Lasting Value
Users gain clarity in communication, with feedback noting higher engagement. Inspired by SlideGeeks' timelines, it elevates professional storytelling.
Case studies: Sales managers presenting team leads, educators enhancing materials.
For consultants, impress with insights, using charts for data-driven narratives.
Tips for Maximum Effect
Keep simple - focus on key points. Use consistent themes for professionalism. In digital formats, add hyperlinks to portfolios.
Extend to LinkedIn or emails for broader exposure.
Elevate your career presentation - customize this template today.
Frequently Asked Questions
What charts are best for skills?
Bar graphs effectively quantify proficiency levels.
Compatible with older PowerPoint?
Yes, works with most versions.
Can I add photos?
Yes, insert images for personalization.
Ideal for which industries?
Versatile for business, education, consulting.
How to export?
Easily to PDF or images for sharing.
Support for animations?
Yes, add for dynamic reveals.
Good for
- Project roadmaps and sprint plans
- Product launch timelines
- Quarterly or annual review decks
- Company history and milestone summaries
Licence
reviews
I used this for school and it made my data clear
Office report was easier to present with these visuals
The layout helps guide attention well
I just needed something usable and it was fine
It is okay but not very detailed
FAQ
Will it work in Google Slides?
Are fonts embedded?
Can I use this for client work?
What's the refund policy?
Do you update the template after purchase?
Similar templates
See all PowerPoint Charts →

All 6 slides