Free Speedometer Dashboard PowerPoint Template - Fully Editable & Instant Download


Type: PowerPoint Charts template
Category: Free Templates, Relationship, Illustrations
Sources Available: .pptx
Product ID: PC00632
Template incl.: 16 editable slides
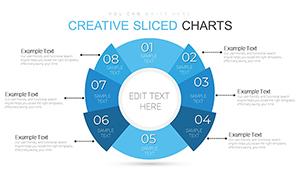
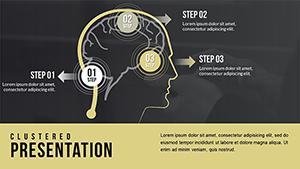
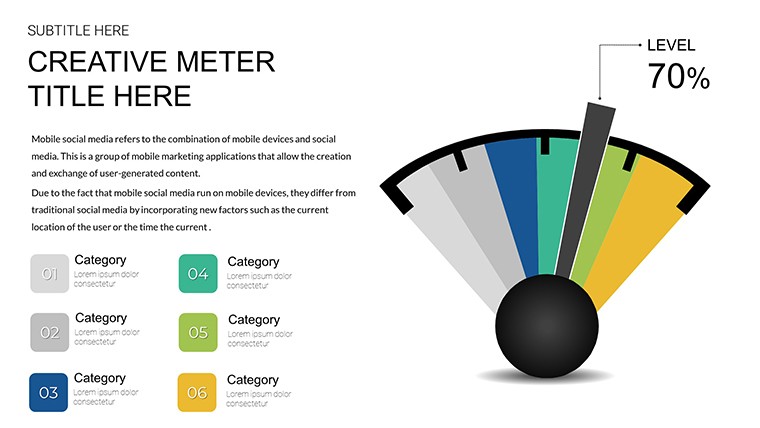
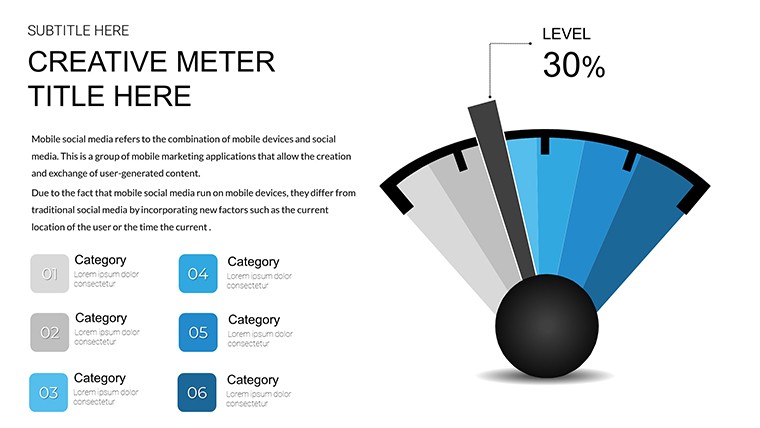
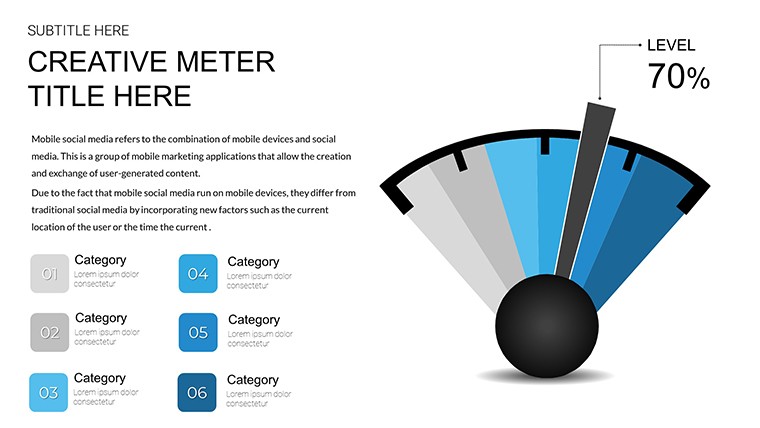
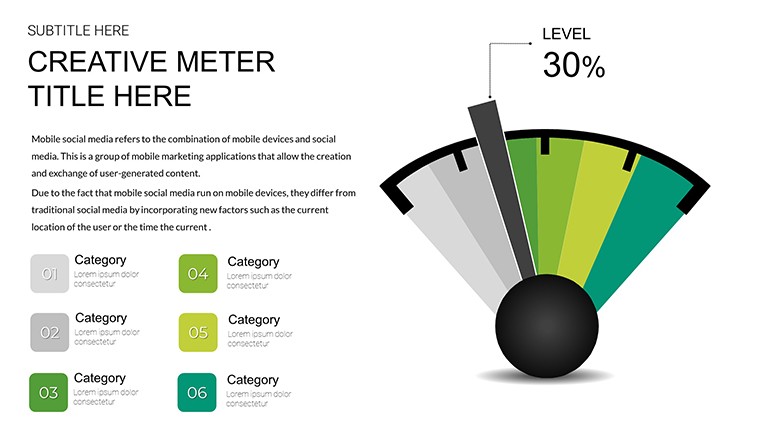
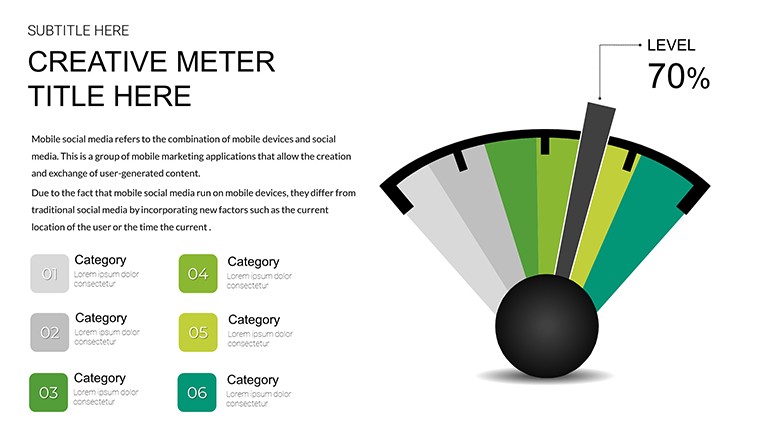
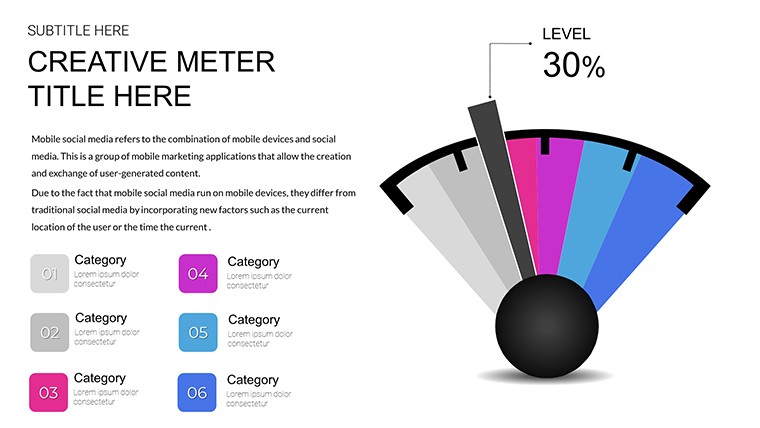
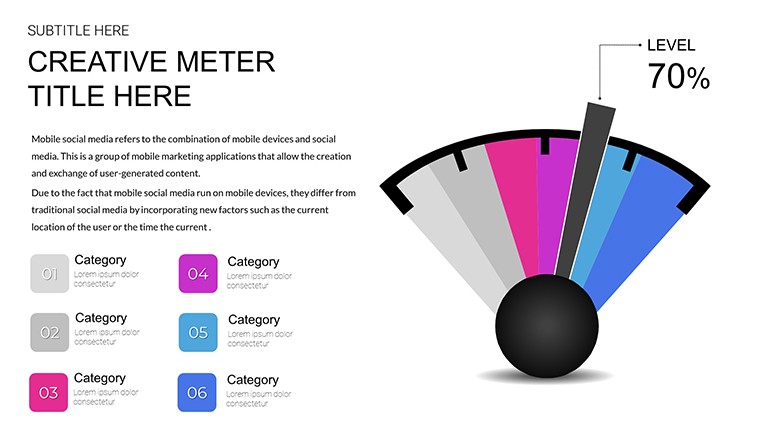
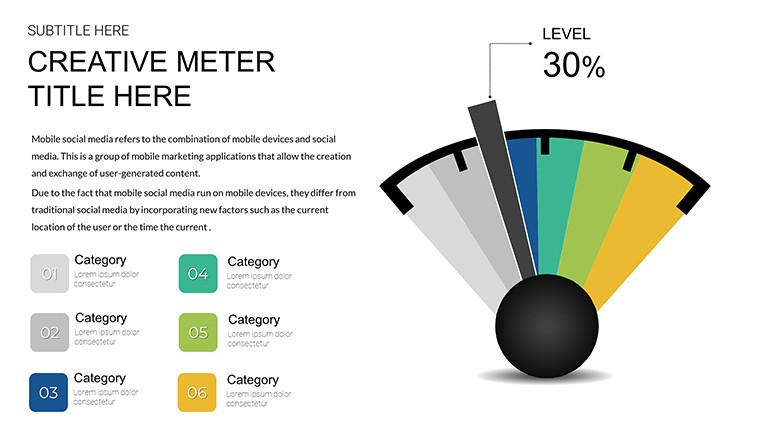
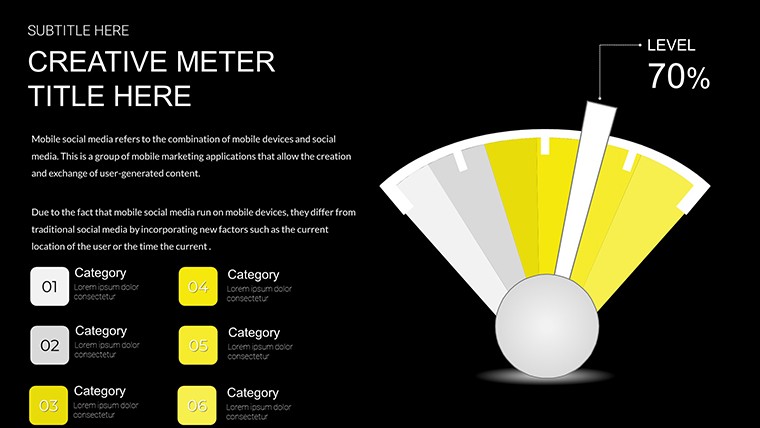
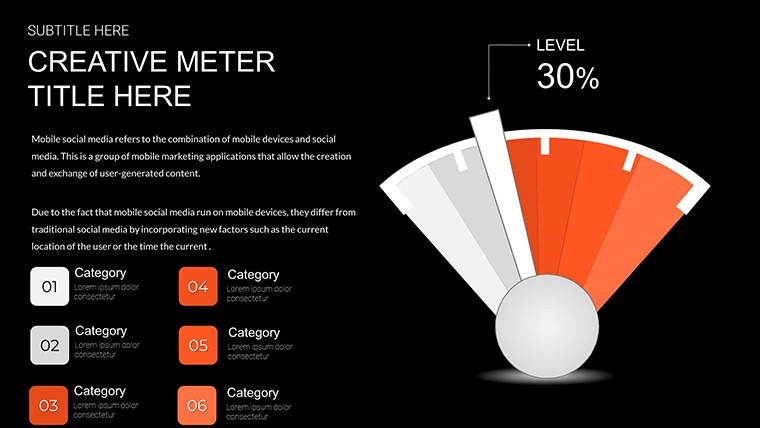
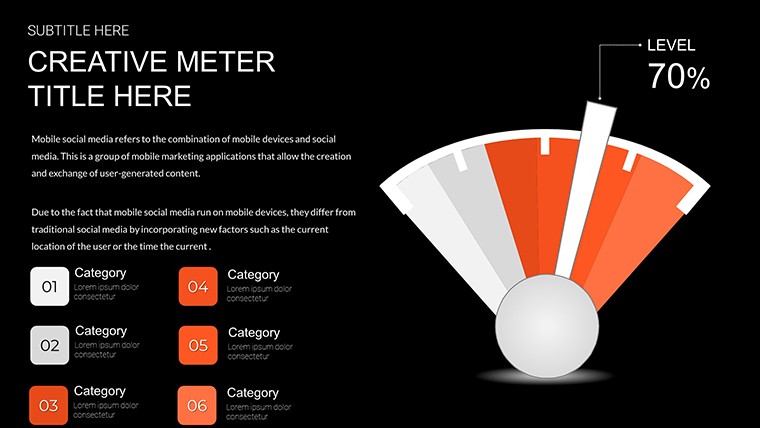
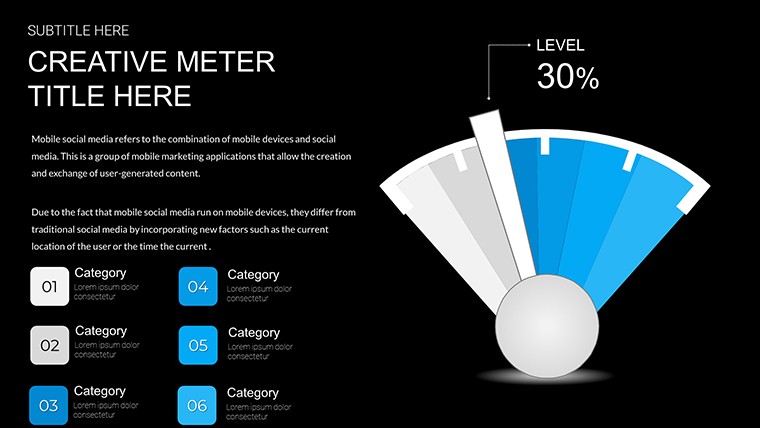
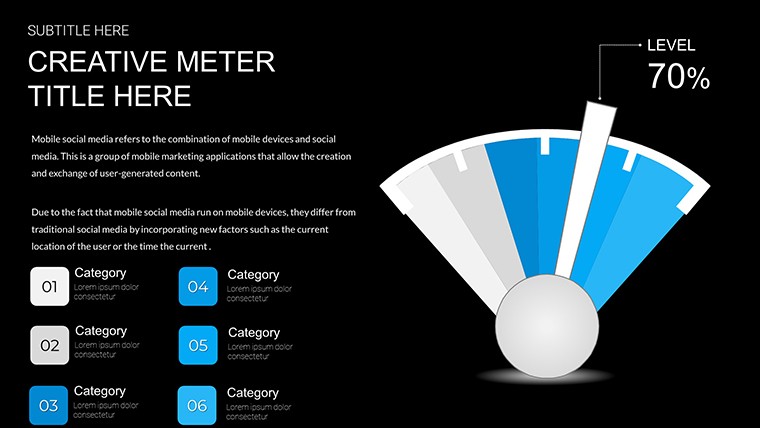
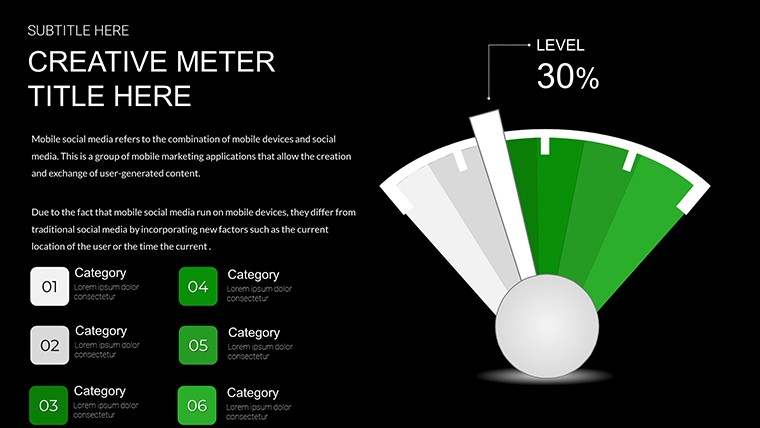
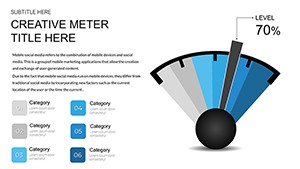
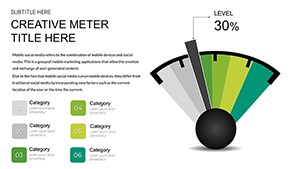
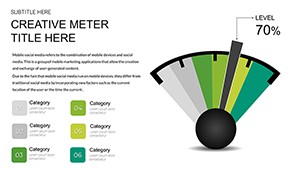
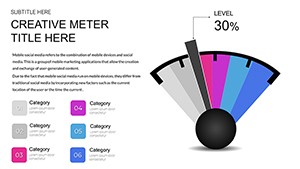
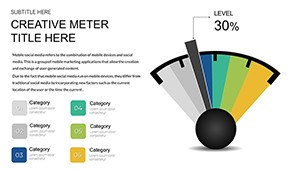
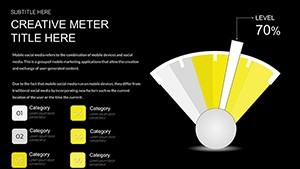
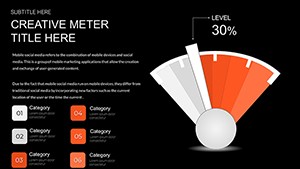
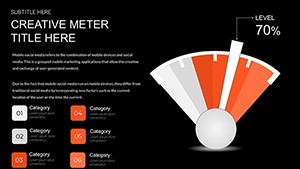
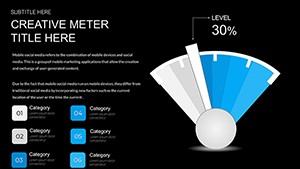
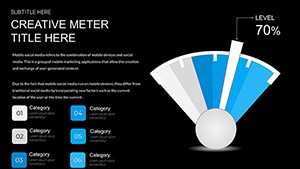
Think of your key metrics as a vehicle's dashboard - clear, immediate, and essential for navigation. Our free Speedometer Dashboard PowerPoint template brings that analogy to life with 16 fully editable slides designed for dashboard-style visuals.
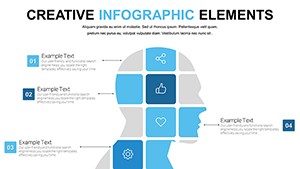
Whether you're a marketer monitoring campaigns, a project manager overseeing milestones, or an educator tracking progress, this template transforms data overload into streamlined gauges highlighting what's crucial.
Benefits of Using Speedometer Dashboards
- Visual clarity for KPIs and project metrics
- Simplifies complex data for presentations
- Enhances team discussions and stakeholder reporting
How to Use the Template
1. Download the free template
2. Open in PowerPoint or Google Slides
3. Input your data values
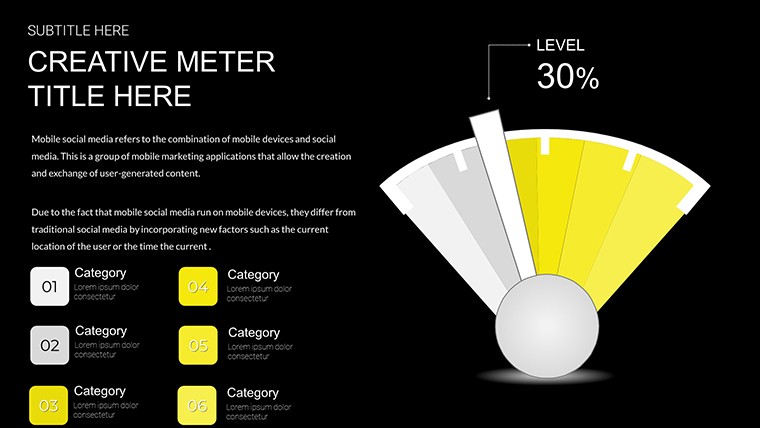
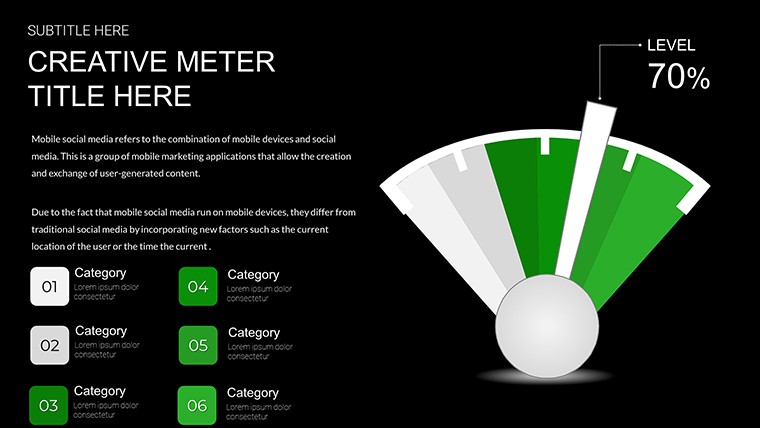
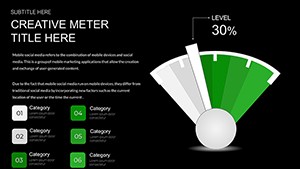
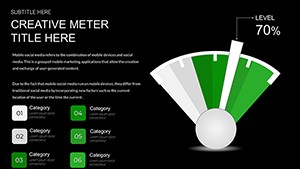
4. Customize gauge colors and styles
5. Present or share your dashboard seamlessly
Key Features
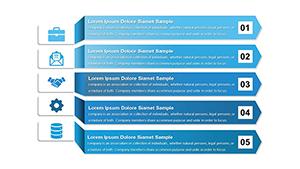
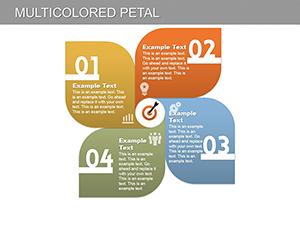
- 16 editable slides with multiple gauge styles
- Fully editable graphics and data inputs
- Beginner-friendly and versatile for any sector
- Inspired by UX principles for intuitive design
Practical Scenarios
Marketing teams can set gauges for ROI or campaign performance. Project managers can monitor milestones. Educators can track course completion. Finance teams can oversee budgets, ensuring clear and actionable insights across industries.
Creative Tips
Prioritize key metrics on main slides, experiment with color-coded gauges, and animate dials for emphasis. Duplicate slides or merge with other presentations for extended dashboards.
Ignite your presentations with visually compelling dashboards and download the free template today.
Frequently Asked Questions
How customizable are the speedometer gauges?
Fully customizable, including colors, scales, and data inputs for personalized dashboards.
Compatible with Google Slides?
Yes, edit freely in both PowerPoint and Google Slides.
Ideal for which industries?
Business, marketing, education, finance, and more for KPI and performance tracking.
Any cost involved?
No, the template is completely free with no hidden fees.
Can I expand the template?
Yes, duplicate slides or merge with other templates for comprehensive dashboards.