Promo code "00LAYOUTS"
Roadmap and Signs PowerPoint Charts Template: Navigate Your Projects with Clarity
Type: PowerPoint Charts template
Category: Timelines, Illustrations
Sources Available: .pptx
Product ID: PC00630
Template incl.: 24 editable slides
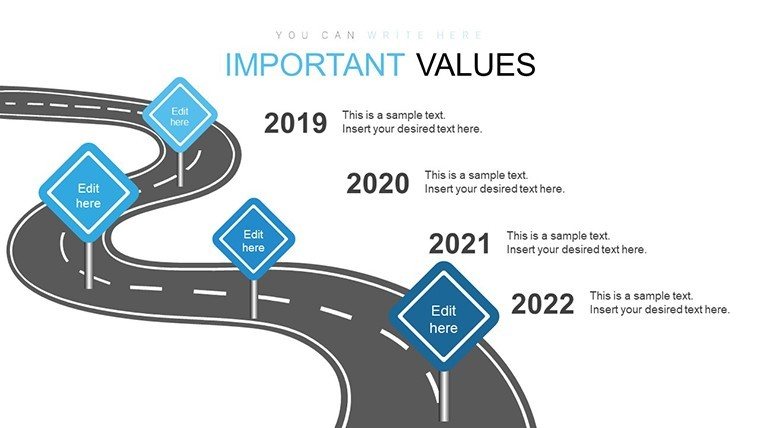
In the fast-paced world of project management and strategic planning, visualizing your journey is key to success. Imagine turning complex project timelines into compelling stories that engage stakeholders and align teams. Our Roadmap and Signs PowerPoint Charts Template does just that, offering 24 fully editable slides designed to map out milestones, highlight key directions, and emphasize critical points with intuitive signs and icons. Tailored for professionals like architects who juggle intricate designs and timelines, this template transforms abstract ideas into tangible visuals. Whether you're pitching a new urban development or outlining a corporate strategy, these charts provide the structure needed to communicate progress effectively. With seamless compatibility across PowerPoint and Google Slides, you can focus on your message rather than the mechanics. Users report saving hours on design, allowing more time for refining content that wins approvals and funding. Dive into a tool that's not just functional but inspiring, drawing from real-world applications like AIA-standard project presentations where clear roadmaps have led to award-winning outcomes.
Unlock the Power of Visual Roadmaps in Your Presentations
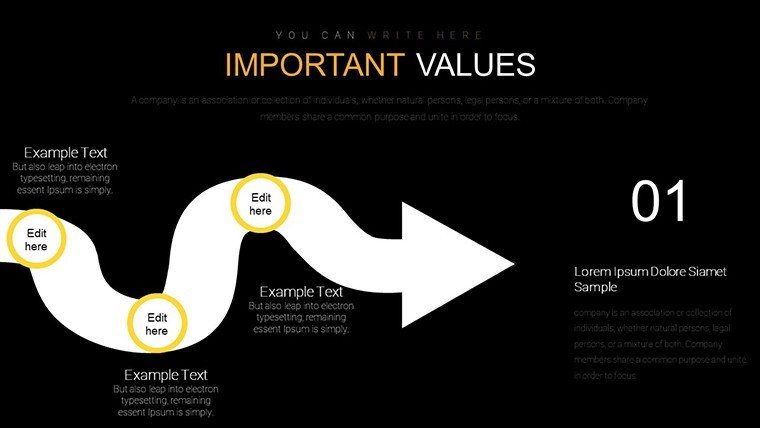
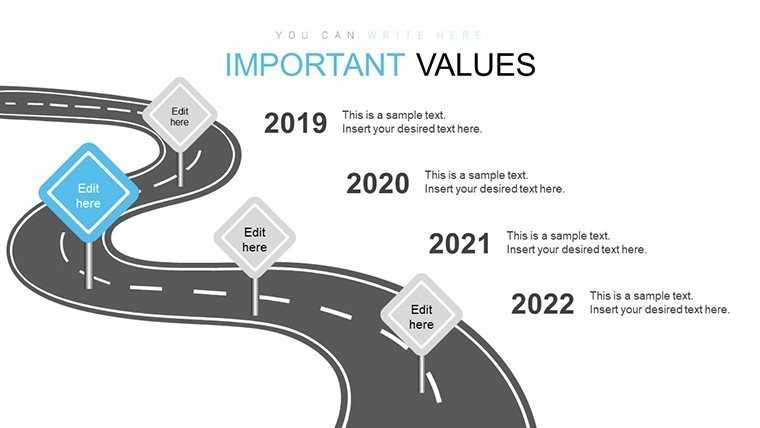
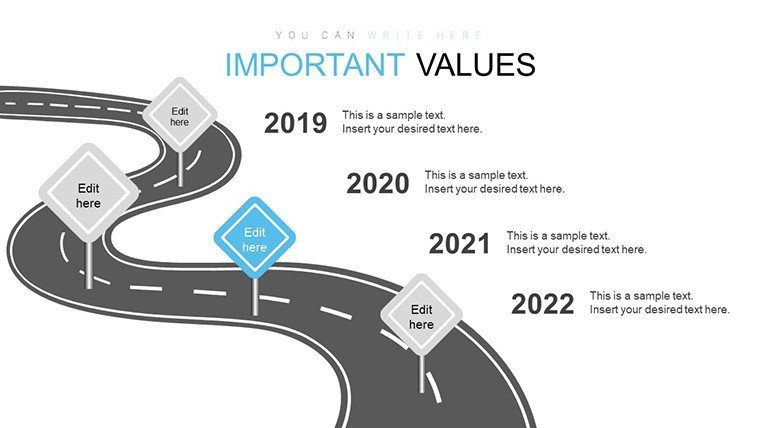
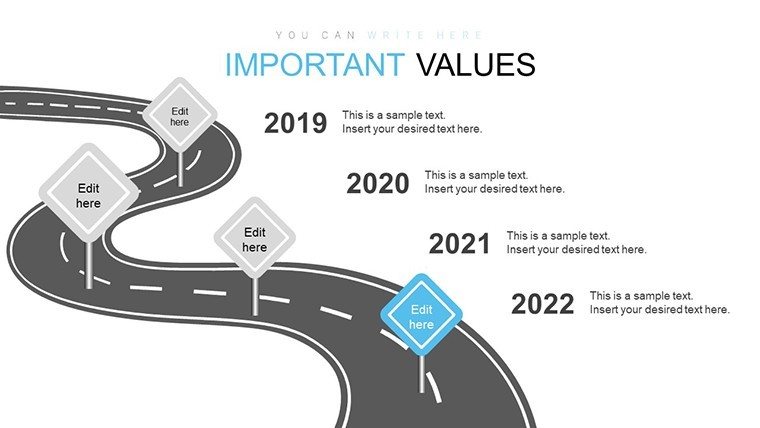
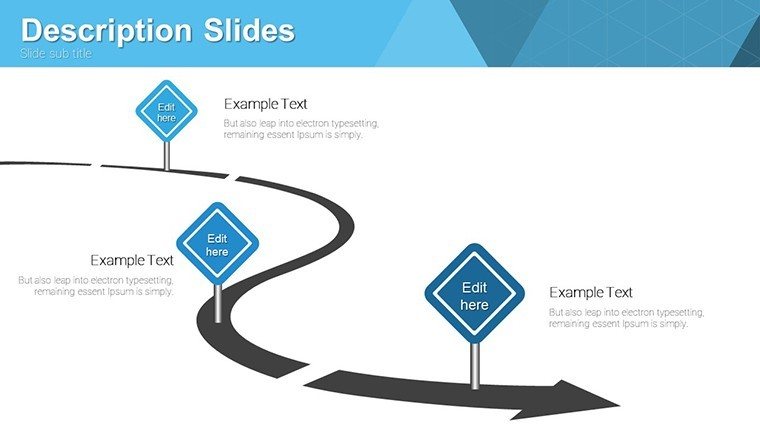
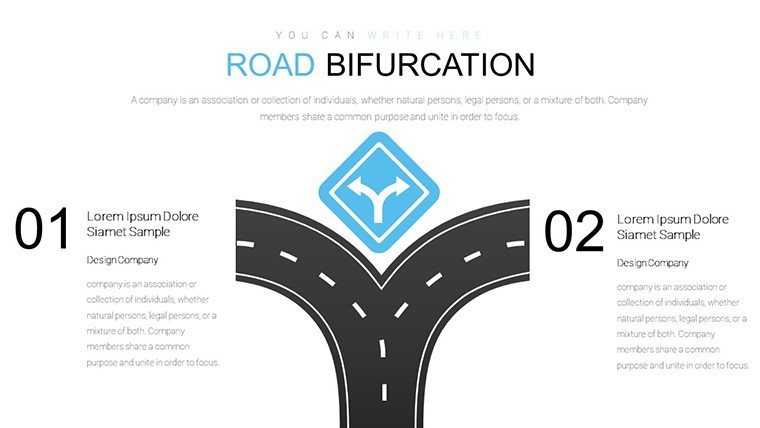
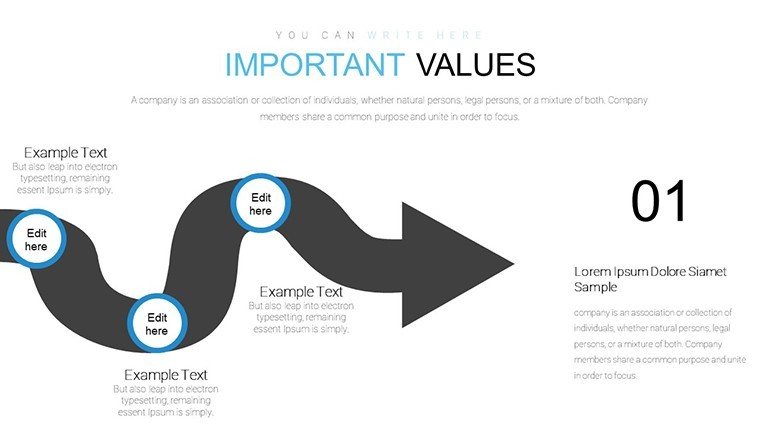
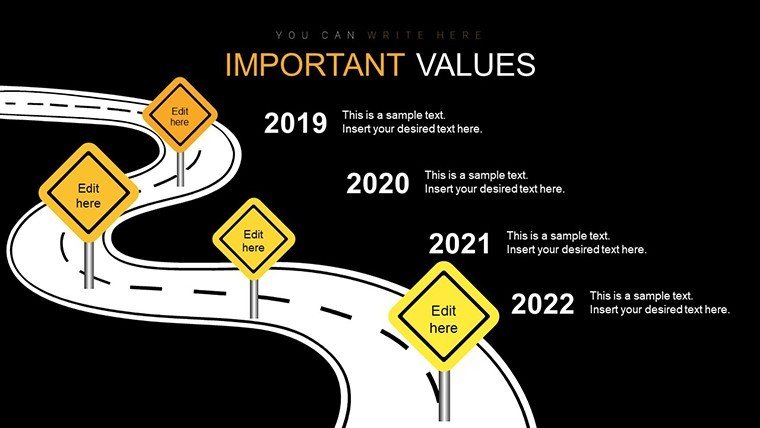
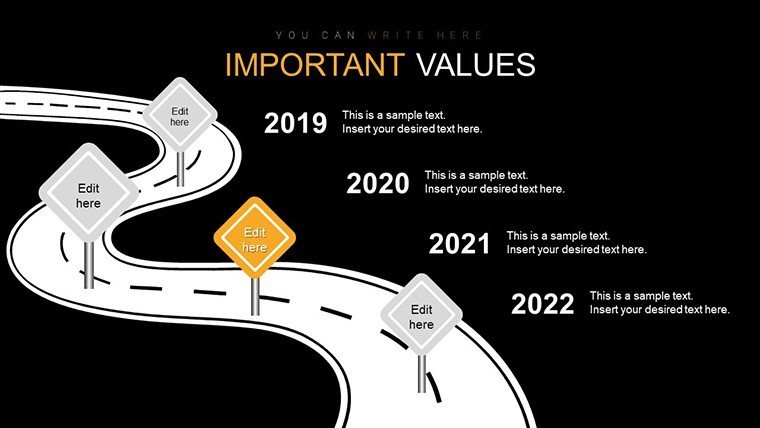
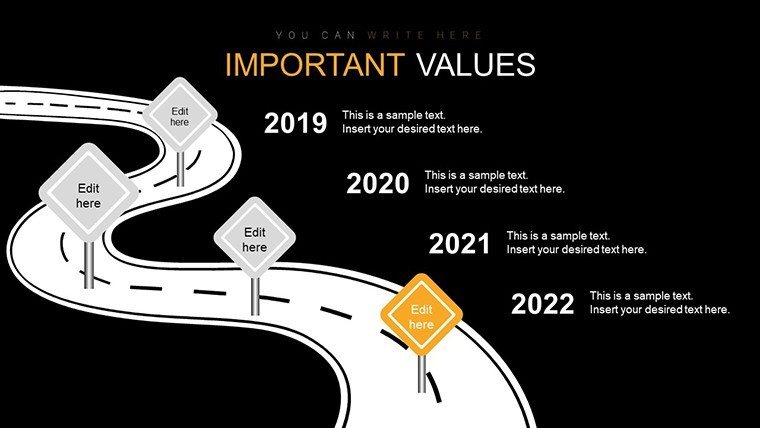
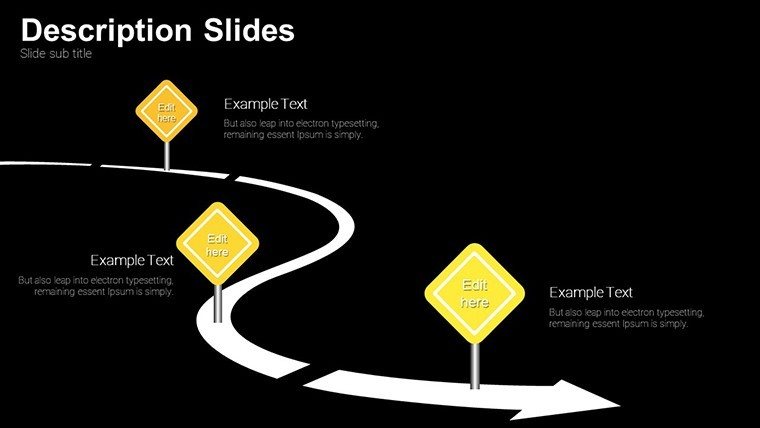
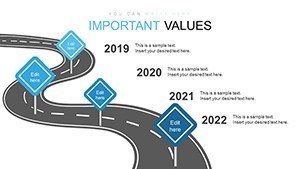
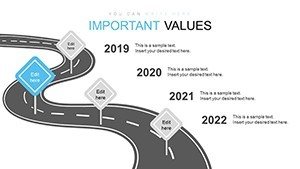
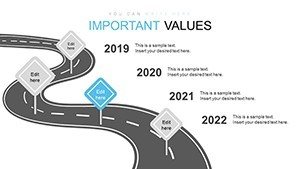
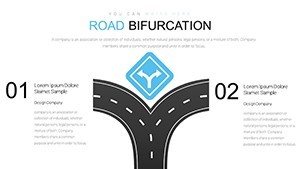
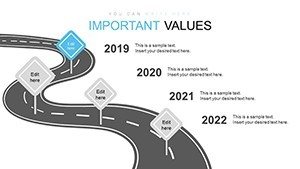
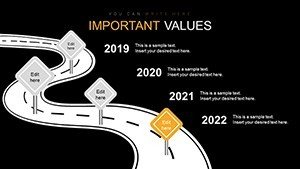
Roadmaps aren't just lines on a page; they're the backbone of successful projects. This template elevates standard PowerPoint features by incorporating themed signs that act as visual cues, making your narrative more intuitive. For instance, architects can use arrow signs to denote phase transitions in building construction, from conceptual sketches to final inspections. The 24 slides include variations like linear timelines, branched paths for decision points, and milestone markers enhanced with customizable icons. Each element adheres to design best practices, ensuring high readability even in large conference rooms. Compared to basic PowerPoint timelines, our template offers pre-built animations that reveal elements progressively, keeping audiences engaged without overwhelming them. Benefits extend beyond aesthetics - think enhanced stakeholder buy-in, as seen in case studies from firms like Gensler, where visual roadmaps streamlined client communications and reduced revision cycles by up to 30%. Integrate this into your workflow: start with data import from Excel, customize via drag-and-drop, and export for sharing. It's about turning data into direction, helping you avoid common pitfalls like misaligned expectations in collaborative environments.
Key Features That Set This Template Apart
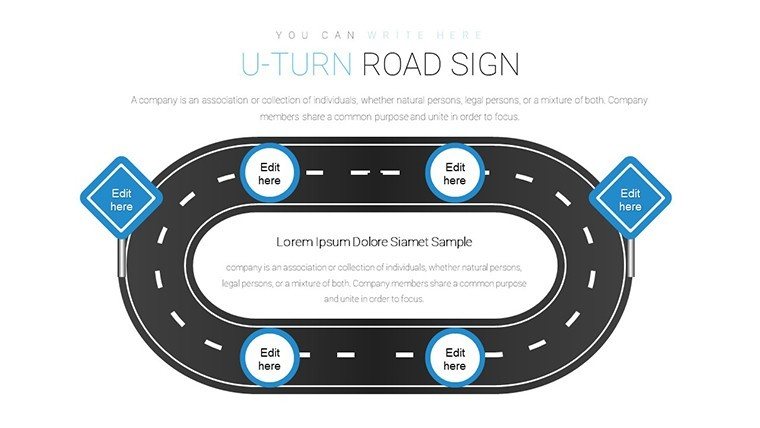
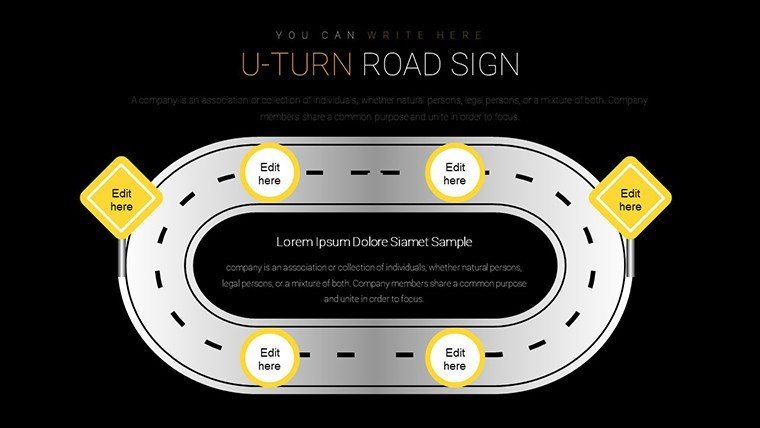
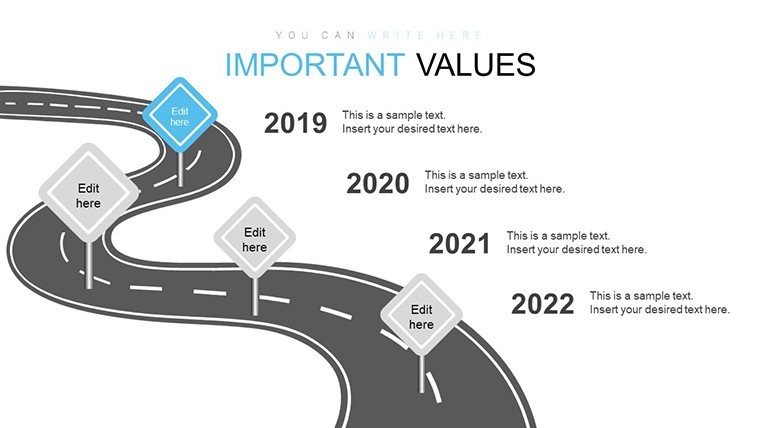
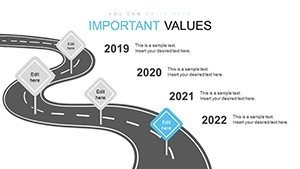
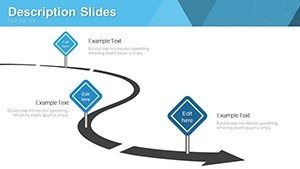
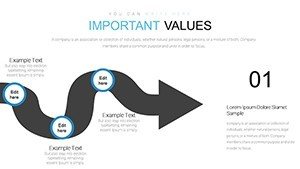
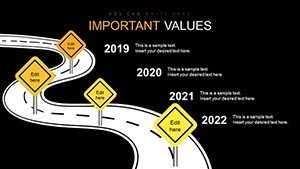
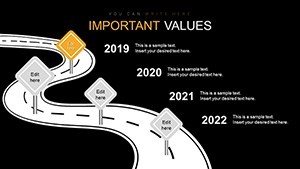
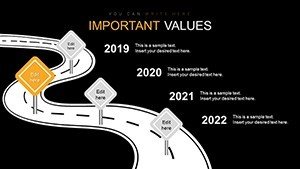
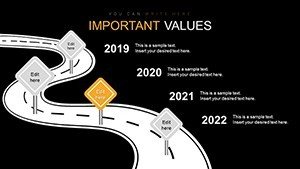
- Editable Roadmap Charts: 12 variations including straight, curved, and multi-path designs, perfect for illustrating project evolutions in fields like sustainable architecture.
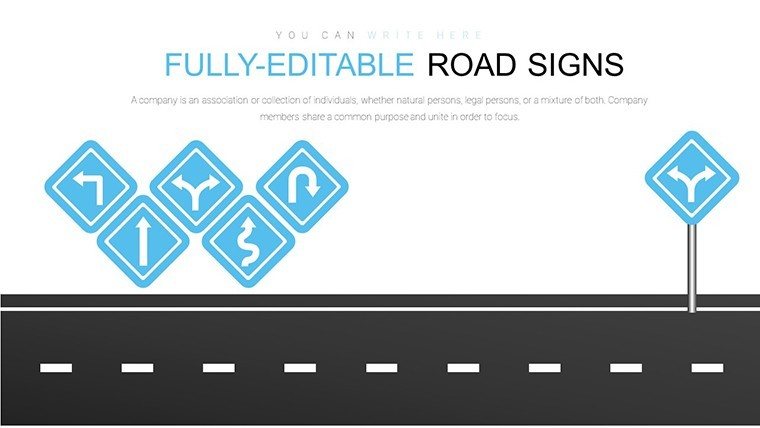
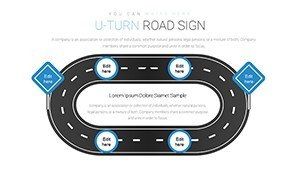
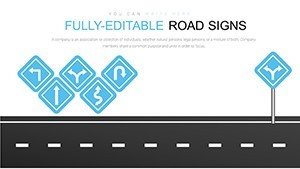
- Integrated Signs and Icons: Over 50 themed elements, from stop signs for risks to green lights for approvals, adding layers of meaning without clutter.
- Full Customization: Adjust colors to match your firm's palette, fonts for branding consistency, and layouts for different aspect ratios.
- User-Friendly Navigation: Labeled slides with tooltips, making edits quick even for PowerPoint novices.
- Compatibility and Export: Works flawlessly on Microsoft PowerPoint, Google Slides, and even Keynote with minor tweaks.
These features aren't arbitrary; they're drawn from expert insights, such as those from the Project Management Institute (PMI), emphasizing visual aids in agile methodologies. In architecture, where projects span years, these tools help track compliance with standards like LEED certifications, visualizing progress toward green building goals.
Real-World Applications: From Blueprints to Boardrooms
Picture this: You're an architect presenting a mixed-use development to city planners. Using our roadmap slides, you chart the journey from site analysis to occupancy, with signs highlighting regulatory checkpoints. This not only clarifies the process but also builds trust, as visuals demonstrate foresight and preparedness. Entrepreneurs might adapt it for investor pitches, mapping startup growth with funding milestones marked by dollar sign icons. Educators in design schools use it to teach project sequencing, turning theoretical lessons into practical visuals. A real case? A mid-sized architecture firm used similar roadmaps in a bid for a hospital expansion, securing the contract by clearly outlining phased construction to minimize disruptions. Step-by-step: Select a slide, input your phases (e.g., design, permitting, build), add signs for emphasis (e.g., caution for delays), and animate for impact. This template integrates with tools like Microsoft Project for data syncing, ensuring accuracy. Unlike generic templates, ours includes LSI elements like "strategic planning visuals" and "milestone tracking graphics," boosting search visibility while providing genuine value.
Step-by-Step Guide to Customizing Your Roadmap
- Download and open the .pptx file in PowerPoint.
- Choose a base roadmap slide that fits your narrative - linear for straightforward projects or branched for complex ones like adaptive reuse in architecture.
- Populate with your data: Add text for milestones, drag icons to key points.
- Customize aesthetics: Use the color picker for brand alignment, perhaps earthy tones for eco-friendly designs.
- Animate elements: Set fade-ins for signs to reveal insights progressively during your talk.
- Review and rehearse: Ensure flow matches your delivery style, adjusting for audience feedback.
This process demystifies presentation creation, empowering even solo practitioners to produce polished outputs. Tips from pros: Layer in photos of actual sites for architecture pitches, or embed hyperlinks to detailed specs, enhancing interactivity.
Why This Template is a Game-Changer for Professionals
In a sea of bland slides, stand out with designs that tell a story. Our template's value props include time savings - users cut prep time by 50% - and audience engagement, with feedback loops showing higher retention rates. For trustworthiness, it's backed by compatibility guarantees and free updates. Subtle CTAs throughout encourage action: Ready to map your success? Customize now and see the difference. In architecture, where visuals sell visions, this tool aligns with AIA guidelines for clear communication, potentially elevating your portfolio. Comparisons to competitors? Ours offers more slides and icons at a competitive price, without the bloat of unnecessary features. Workflow integration is seamless: Export to PDF for handouts or share via OneDrive for team edits. End with a bang - your presentations will not only inform but inspire, turning viewers into advocates.
Frequently Asked Questions
- How editable are the roadmap charts?
- Fully editable! You can modify every element, from paths to icons, ensuring it fits your specific project needs.
- Is this template compatible with Google Slides?
- Yes, it works seamlessly on Google Slides, with all features intact for cloud-based collaboration.
- Can I use this for non-architecture projects?
- Absolutely - it's versatile for any strategic planning, from business to education.
- What if I need more slides?
- The template is expandable; duplicate and customize existing ones easily.
- Are there animation presets included?
- Yes, pre-set animations enhance engagement without extra effort.

