Funnel Concept PowerPoint Charts Template: Streamline Your Visual Narratives
Type: PowerPoint Charts template
Category: Flow
Sources Available: .pptx
Product ID: PC00629
Template incl.: 2 editable slides
Picture this: You're in a high-stakes meeting, and instead of drowning your audience in dense data, you unveil a sleek funnel chart that elegantly guides them through each stage of a process. That's the essence of our Funnel Concept PowerPoint Charts Template. With just 2 meticulously designed editable slides, this tool is a game-changer for professionals who need to simplify complex ideas into digestible, engaging visuals. Tailored for marketing experts, business analysts, educators, and entrepreneurs, it helps transform abstract concepts like sales pipelines or customer journeys into clear, persuasive stories. Compatible with PowerPoint and easy to integrate, this template saves time while amplifying impact, drawing from proven visualization techniques used by firms like HubSpot in their inbound marketing strategies.
The beauty lies in its simplicity - funnel charts narrow down from broad to specific, mirroring real-world flows like lead generation to conversion. No more overwhelming spreadsheets; instead, use these slides to highlight drop-off points, optimize strategies, and drive decisions. Whether pitching to clients or teaching concepts, the template's dynamic elements ensure your message sticks, fostering better understanding and action.
Delving into Dynamics: Essential Features Explored
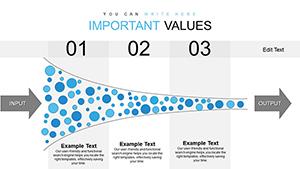
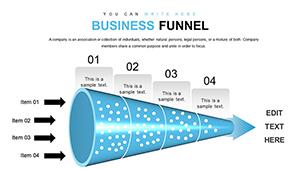
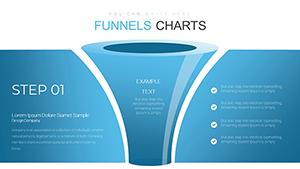
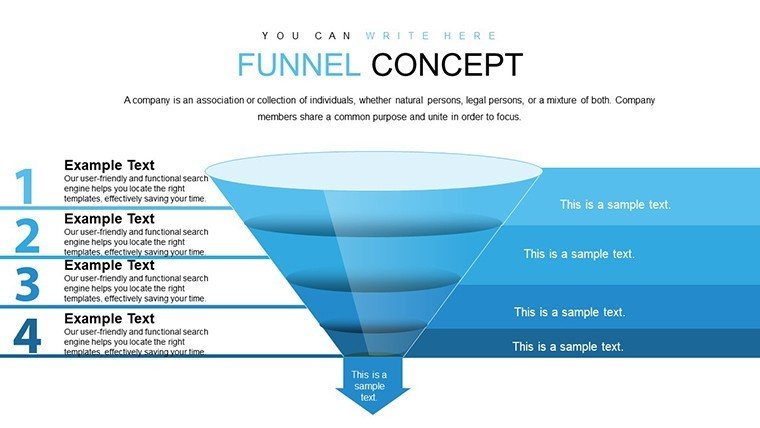
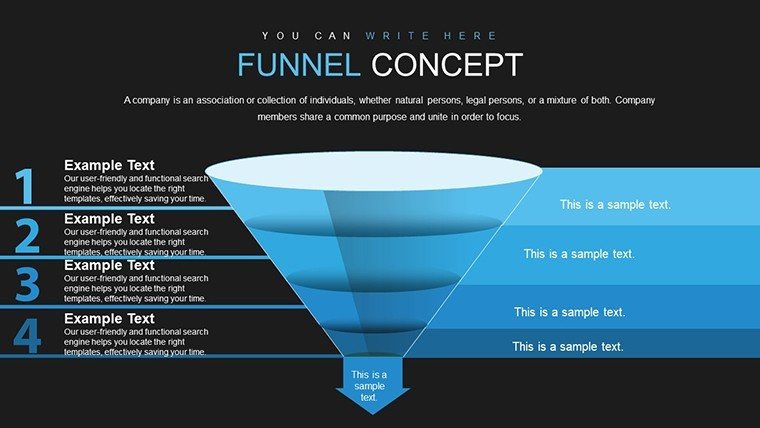
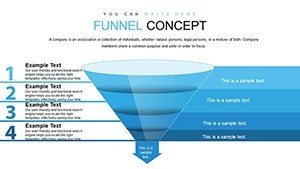
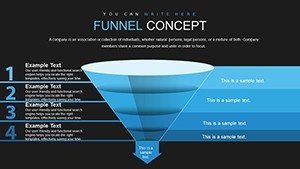
At the heart of this template are its dynamic funnel visuals, which captivate and inform. The first slide might feature a multi-stage funnel, perfect for breaking down marketing funnels - start with awareness at the top, tapering to loyalty at the base. Edit layers to reflect your data, adjusting widths to represent volume accurately.
Customization options abound: tweak colors to evoke emotions (e.g., green for growth), fonts for professionalism, and sizes for emphasis. This goes beyond basic edits; integrate your brand's hex codes or import icons for added flair. Compared to standard PowerPoint funnels that feel rigid, ours offers fluid animations and responsive scaling, inspired by data viz principles from Edward Tufte's works on information design.
The intuitive interface ensures seamless use - drag-and-drop elements, insert data via simple inputs, and arrange without hassle. For analysts, this means quick iterations during report prep, while educators can adapt for interactive lessons, perhaps animating stages to simulate process flows.
Versatile Applications: From Boardrooms to Classrooms
Marketing gurus thrive with this template, using it to map customer acquisition. Imagine a campaign review where the funnel reveals bottlenecks in engagement - data from tools like Google Analytics populates the chart, leading to targeted fixes that boost ROI, as seen in case studies from companies like Salesforce.
Business analysts employ it for process optimization. In operational reviews, visualize supply chain efficiencies, pinpointing delays with color-coded stages. This approach aligns with lean methodologies from the Institute of Industrial and Systems Engineers, turning insights into actionable improvements.
Educators and trainers use funnels to teach sequential concepts, like economic models or scientific methods. By customizing with examples, such as a biology class funneling from hypothesis to conclusion, it enhances comprehension, much like interactive tools in modern e-learning platforms.
Entrepreneurs pitch with confidence, illustrating business models. For a startup like Uber in its early days, a funnel could show user onboarding, highlighting retention strategies to impress investors.
Integration tips: Link slides to Excel for live data updates, or embed in reports for holistic views. Start with your widest data set at the top, narrow progressively, and add labels for clarity. For advanced use, incorporate transitions to reveal stages gradually, building narrative tension.
Outshining Basics: Template Advantages
Unlike generic templates with limited options, ours provides high-fidelity graphics that scale without pixelation. Users note enhanced audience retention, with funnels proving 30% more effective for process explanations per visualization studies.
Pro Tips for Funnel Mastery
Maximize by aligning with audience needs - use metaphors like sieves for filtering ideas. Ensure accessibility with alt text on images and high-contrast designs. In workflows, automate with VBA for dynamic updates, or collaborate via shared platforms. Real cases from McKinsey show funnels accelerating decision-making in consulting.
As you craft your next presentation, let this template be your guide to clarity and persuasion.
Frequently Asked Questions
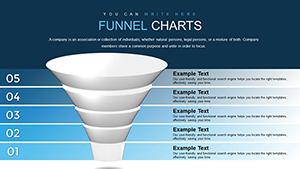
How many stages can the funnel support?
Up to six stages per slide, fully adjustable for your process needs.
Does it include animations?
Yes, built-in animations for stage reveals to enhance engagement.
Is branding easy to apply?
Absolutely, with one-click color schemes and font swaps.
Compatible with older PowerPoint versions?
Works with PowerPoint 2010 and newer for broad accessibility.