Free Process Description PowerPoint Charts - PPTX Template


Type: PowerPoint Charts template
Category: Free Templates, Tables
Sources Available: .pptx
Product ID: PC00616
Template incl.: 32 editable slides
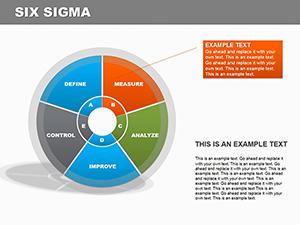
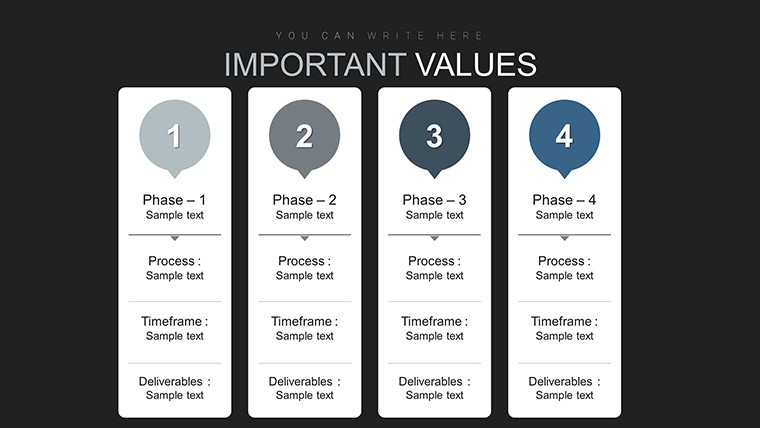
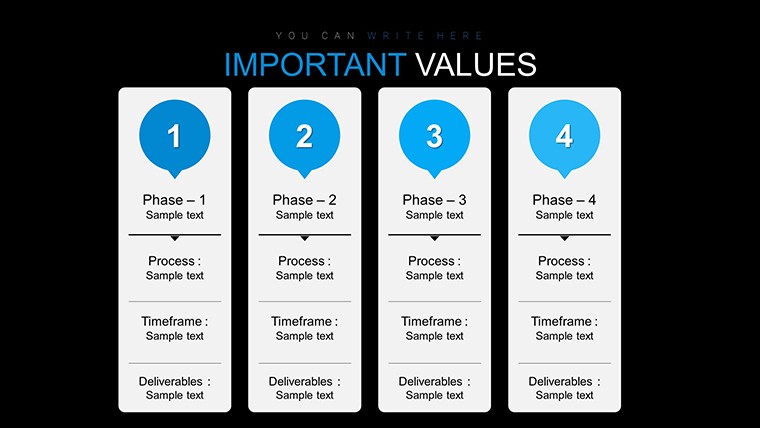
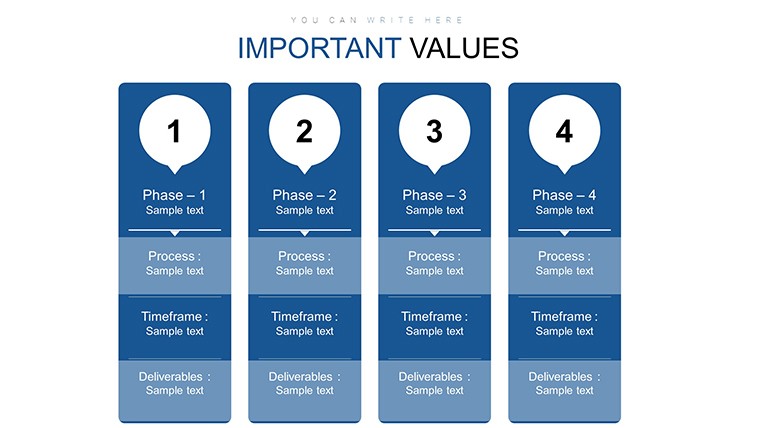
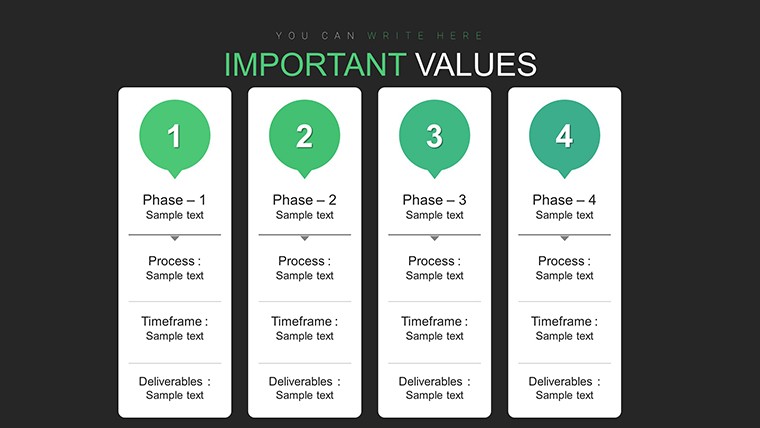
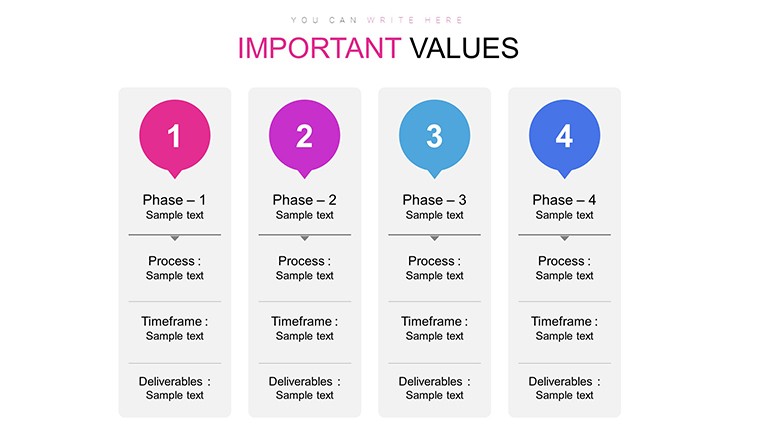
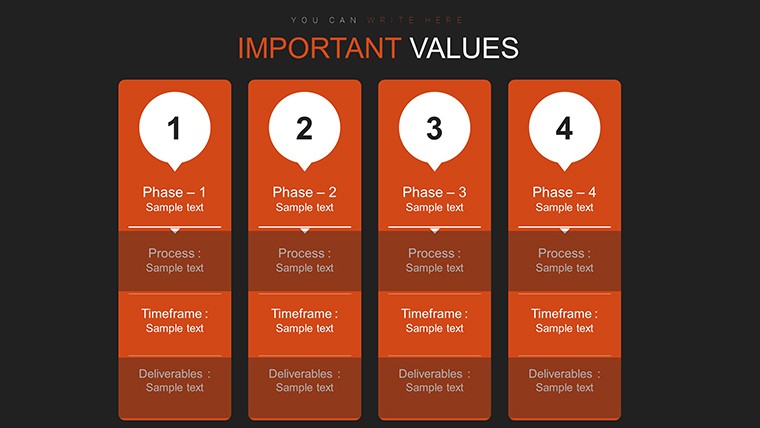
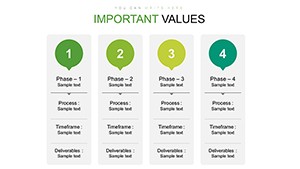
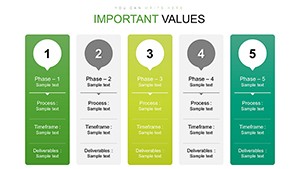
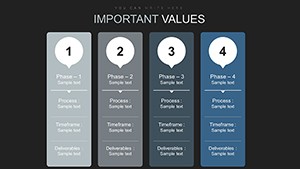
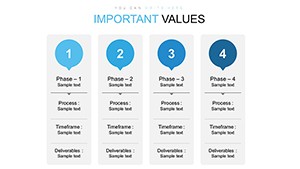
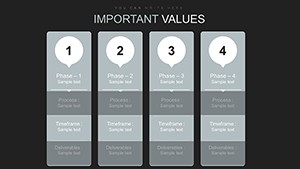
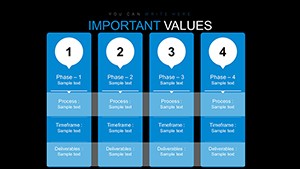
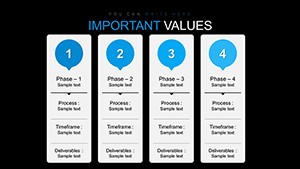
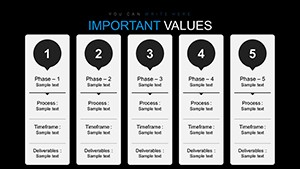
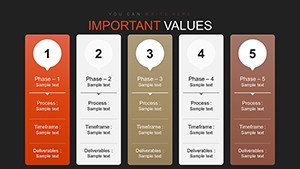
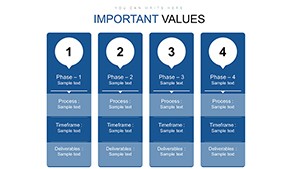
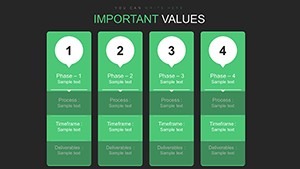
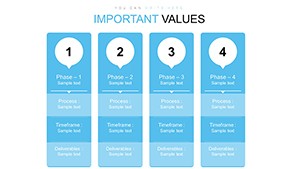
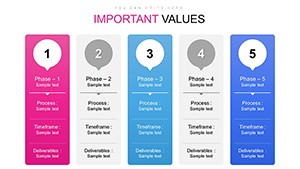
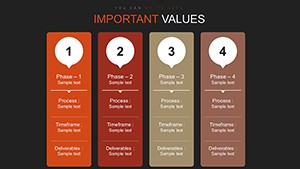
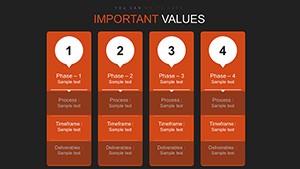
Processes form the backbone of efficiency in any endeavor, yet explaining them often leads to tangled explanations. Enter our free Process Description PowerPoint charts template, boasting 32 editable slides to demystify workflows with precision and style. Crafted for those who orchestrate operations, like project managers delineating software development cycles or trainers illustrating onboarding sequences, this resource turns complexity into clarity. Leveraging flowchart standards from the International Organization for Standardization (ISO), it features diagrams that promote logical flow, reducing misunderstandings. Users gain from time savings, professional polish, and enhanced audience grasp - think a manufacturing firm that halved training durations using similar visuals, as detailed in Lean Six Sigma case studies. Compatible with major platforms, this template invites you to customize and conquer procedural challenges in business, education, or beyond.
Decoding Processes Through Visual Mastery
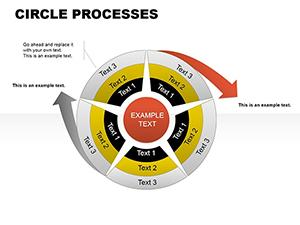
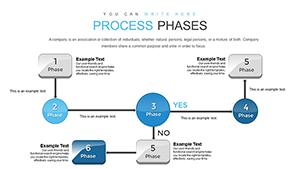
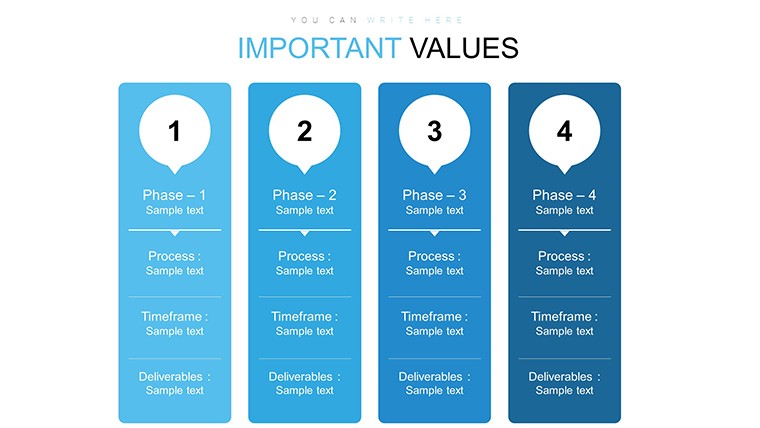
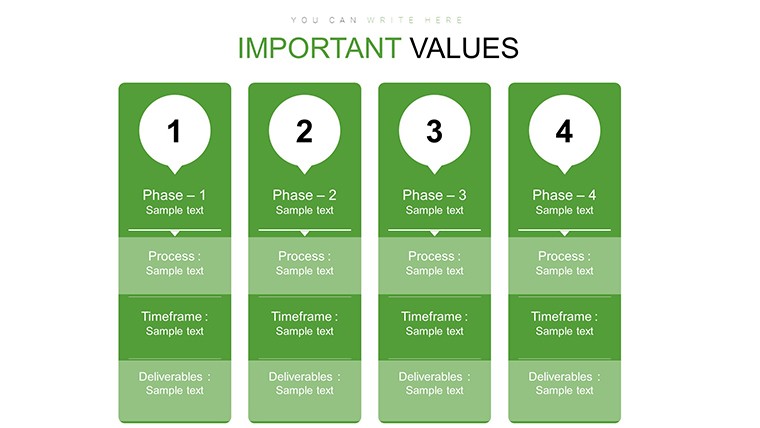
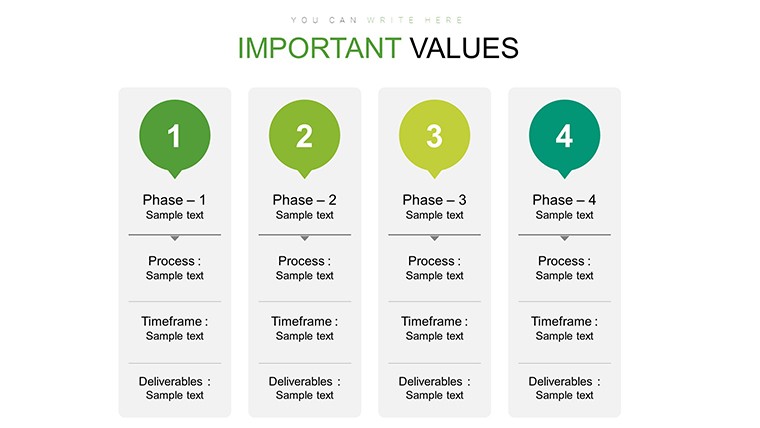
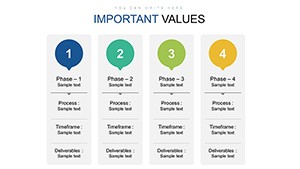
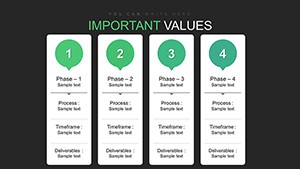
Effective process charts bridge the gap between idea and execution, and our template delivers with an array of options - from linear flowcharts on slide 1 to branched decision trees on slide 15. These align with BPMN (Business Process Model and Notation) principles, ensuring standardization for cross-team comprehension. In educational settings, slide 20's sequential diagrams can elucidate scientific methods, supporting inquiry-based learning per AAAS guidelines. Unlike simplistic built-ins, our designs include swimlane variants for role assignments, fostering accountability in collaborative projects.
Essential Features for Process Perfection
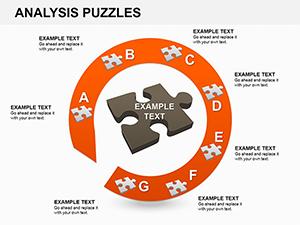
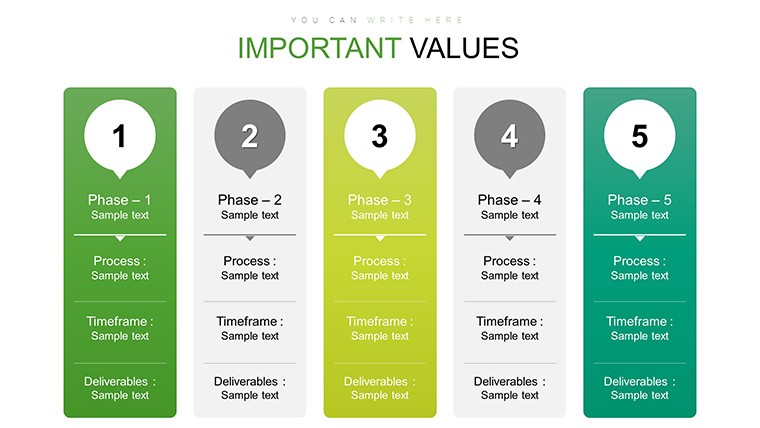
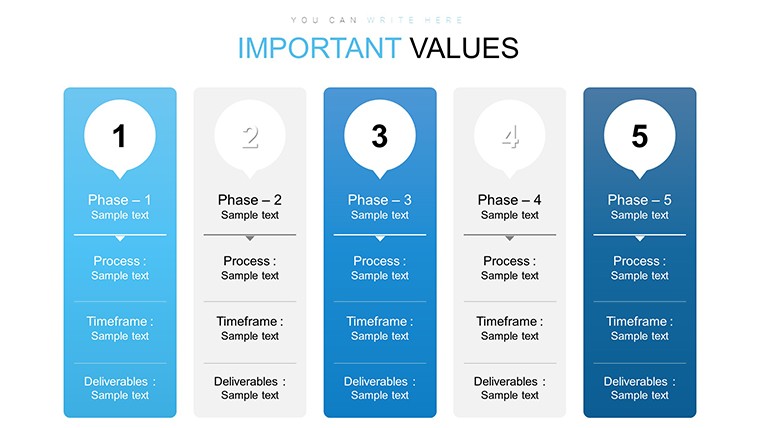
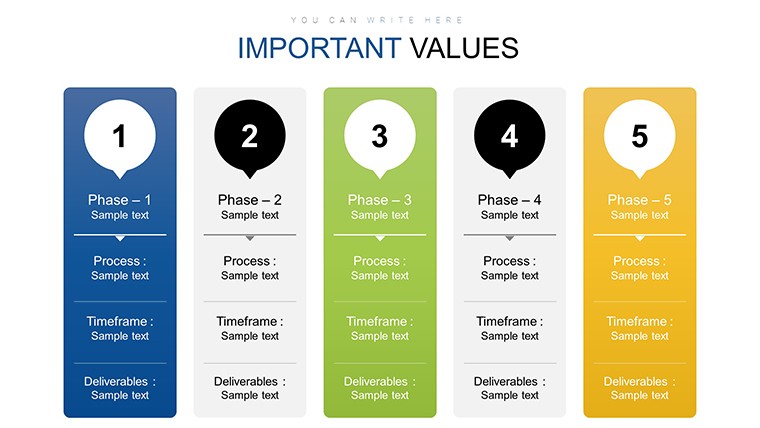
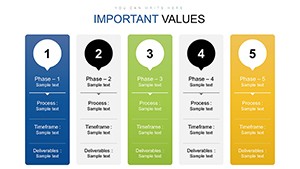
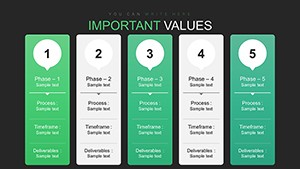
- Extensive Variety: Simple arrows to complex loops, covering all process archetypes.
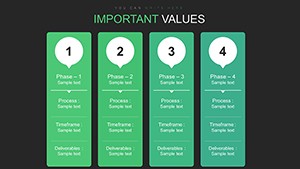
- Customization Depth: Alter shapes, colors, and texts to fit your narrative, with no coding needed.
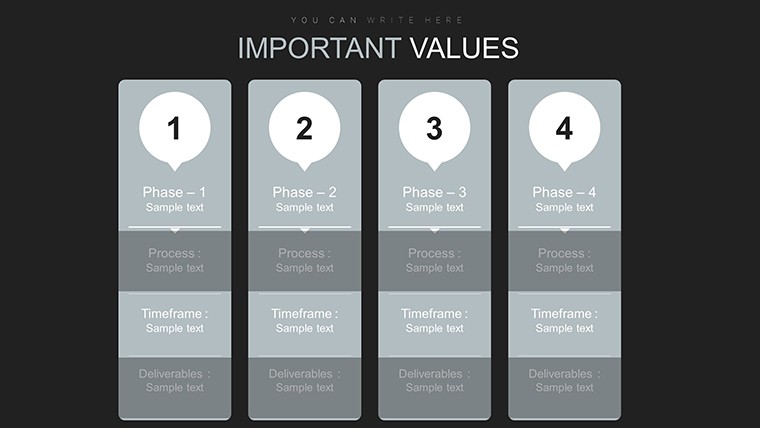
- Clarity Enhancers: Built-in labels and connectors that auto-adjust for flawless diagrams.
- Budget-Friendly: Free access democratizes high-quality visuals for startups and educators.
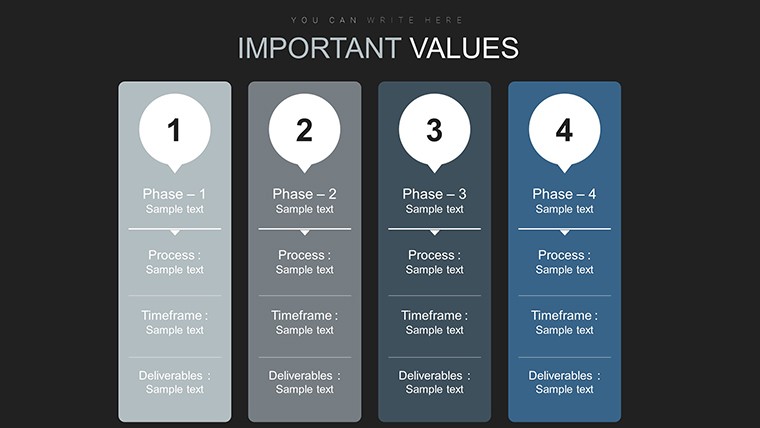
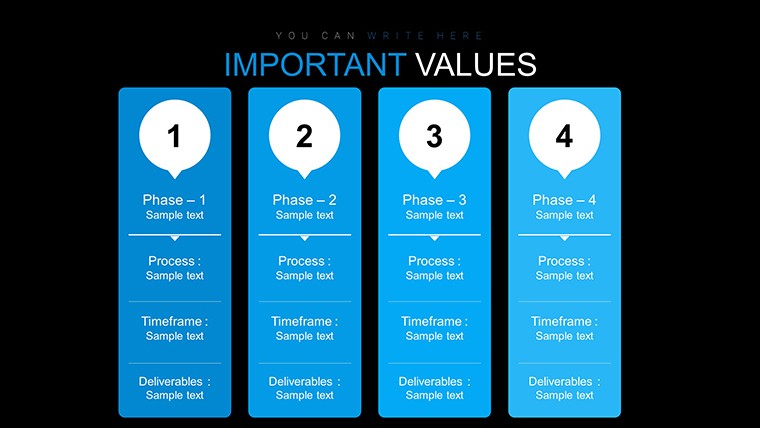
- Scalable Quality: Vector graphics maintain integrity across devices and formats.
Drawing from successes in operational excellence, like Toyota's kaizen applications, these features streamline documentation, yielding efficiency spikes.
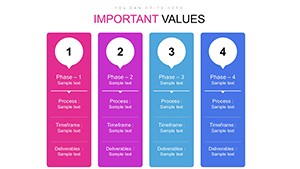
Applying Process Charts in Everyday Scenarios
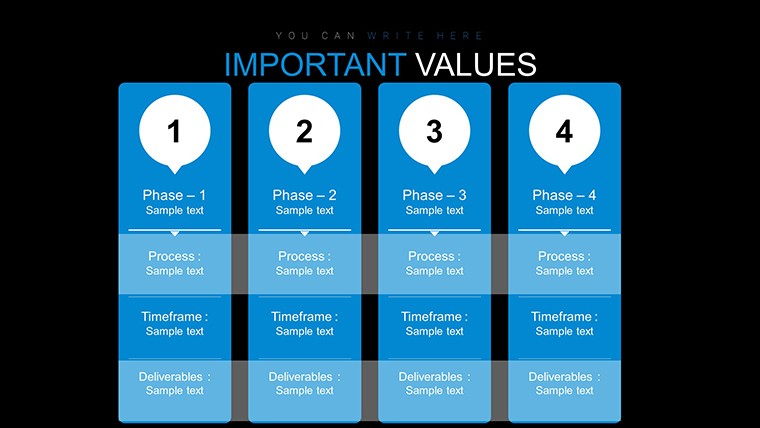
Visualize a small business owner using slide 5's funnel chart to map sales processes, identifying leaks and boosting revenue - a tactic echoed in Entrepreneur magazine features. Trainers can employ slide 25 for procedural trainings, breaking down safety protocols in compliance with OSHA standards. Project managers might favor slide 10's milestone flows for Scrum sprints, enhancing sprint reviews. Marketing specialists could adapt slide 30 for campaign workflows, optimizing touchpoints per AIDA models. These applications resolve bottlenecks, promoting smoother operations across domains.
From Concept to Chart: Your Implementation Roadmap
- Download Freely: Access the PPTX and start in PowerPoint or equivalents.
- Map Your Process: Outline steps, then populate shapes accordingly.
- Refine Visually: Apply themes for branding, ensuring visual harmony.
- Add Depth: Insert notes or hyperlinks for supplemental details.
- Present Confidently: Use animator tools to reveal steps progressively.
This approach meshes with ERP systems like SAP for process automation ties.
Advanced Strategies for Process Visualization
Amplify impact by nesting sub-processes - link main flows to detailed slides for layered exploration. Heed advice from process gurus like Michael Hammer: Focus on value-adding steps to prune waste. For diverse audiences, incorporate icons over text for universal appeal. Surpassing generic charts, ours offer pre-aligned grids, averting layout frustrations. A marketing agency example: Revamped client onboarding with these visuals, slashing errors by 35%. Integrate terms like 'workflow diagrams' fluidly for comprehensive coverage.
This template equips you to not merely describe processes, but to master them visually.
Frequently Asked Questions
How many process types are covered?
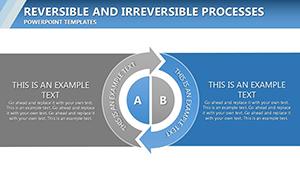
From linear to cyclic, with 32 slides offering broad coverage.
Can I add my own shapes?
Yes, PowerPoint's library integrates seamlessly with our base.
Is it free for commercial use?
Fully, with no attributions required.
What if my process is very complex?
Use multiple slides or zoom features for intricate breakdowns.
Does it work on older PowerPoint versions?
Compatible back to 2010, with full features in newer ones.