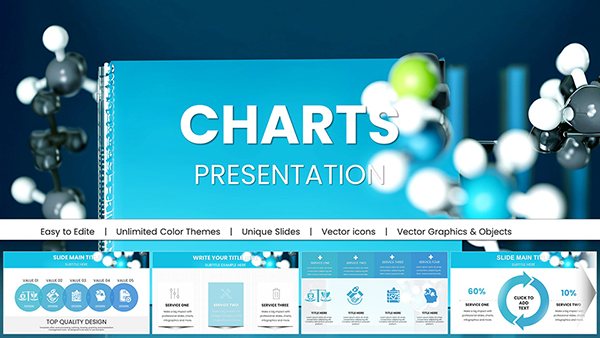
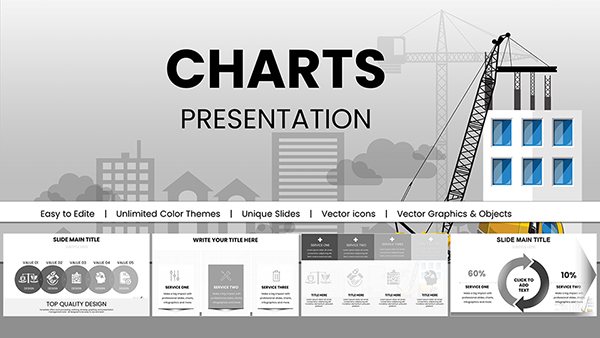
Free Chemical Process Flowchart PowerPoint Template - Fully Editable


Type: PowerPoint Charts template
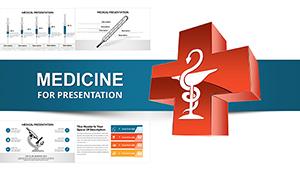
Category: Medicine - Pharma, Free Templates, Illustrations
Sources Available: .pptx
Product ID: PC00613
Template incl.: 18 editable slides
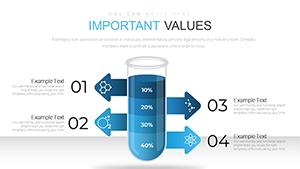
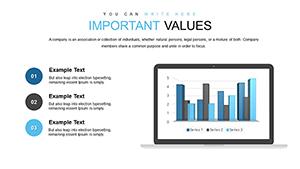
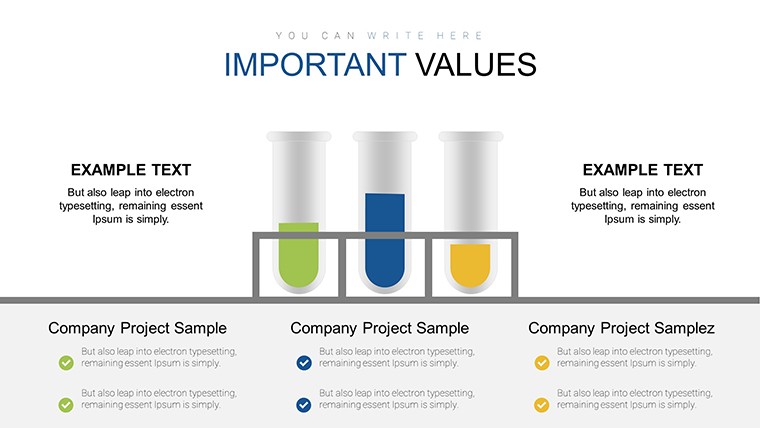
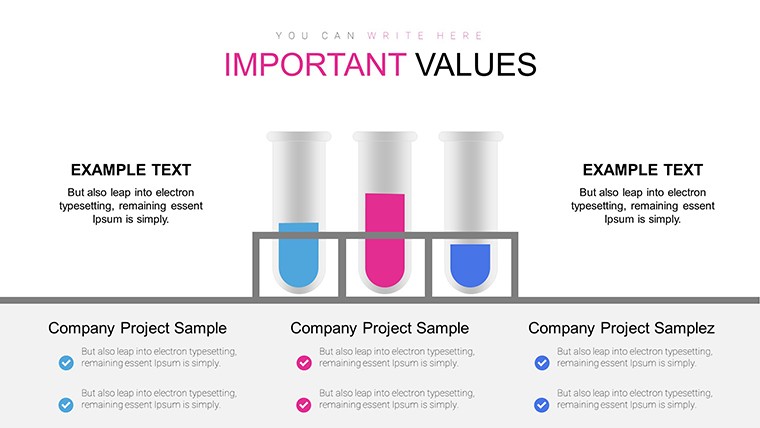
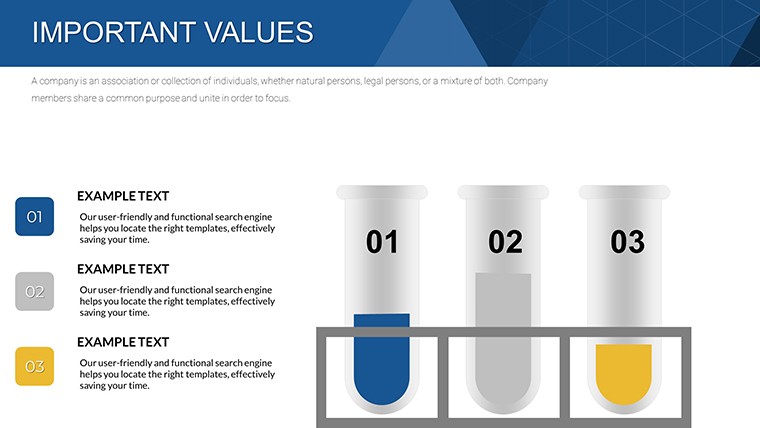
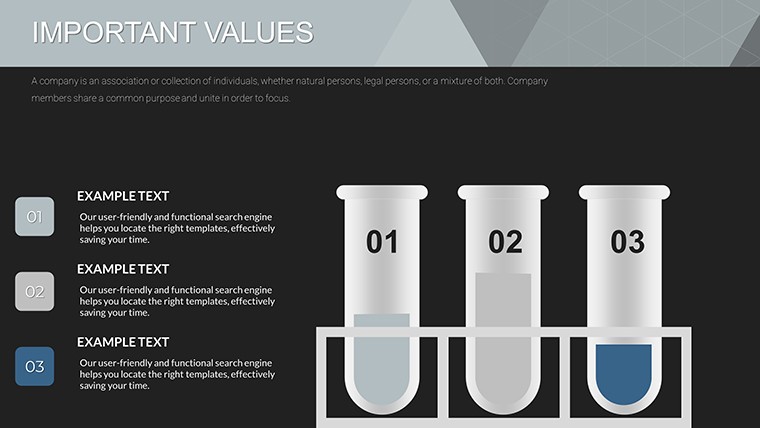
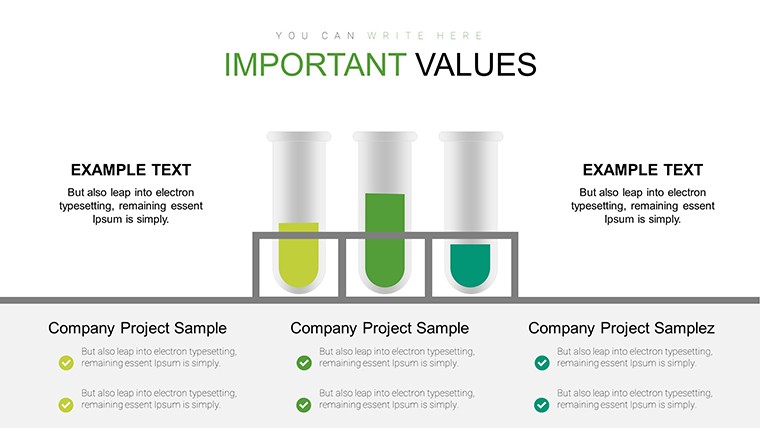
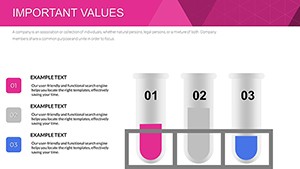
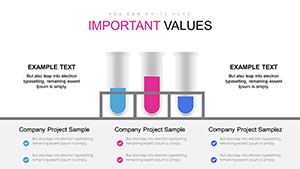
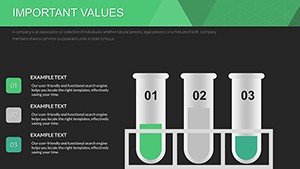
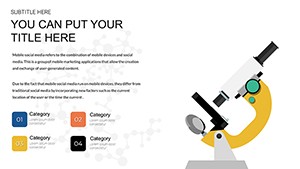
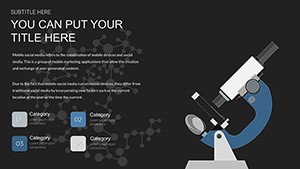
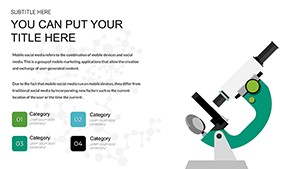
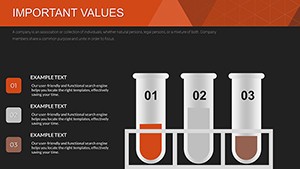
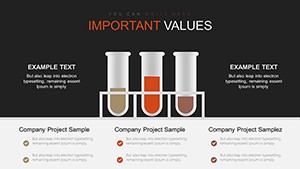
Present chemical test processes with clarity using this free chemical process flowchart PowerPoint template. The editable blocks and structured layouts help professionals illustrate experimental stages, reagents, conditions, and outcomes effectively in scientific and business contexts.
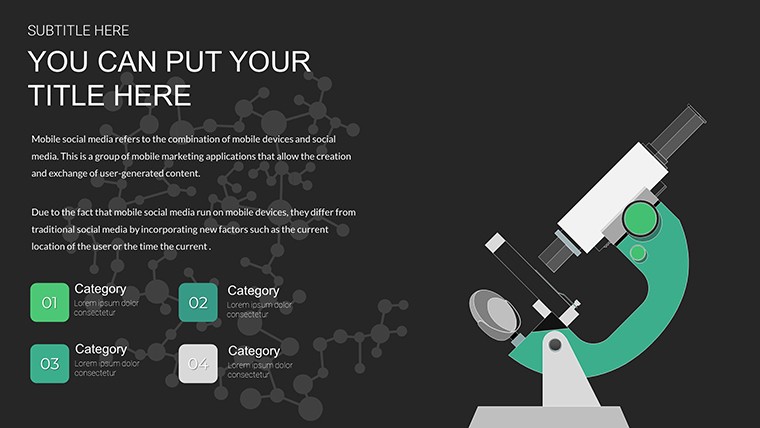
Suitable for laboratory reports, research presentations, educational lectures, and R&D meetings, this template ensures complex chemical procedures are communicated professionally.
Key Features
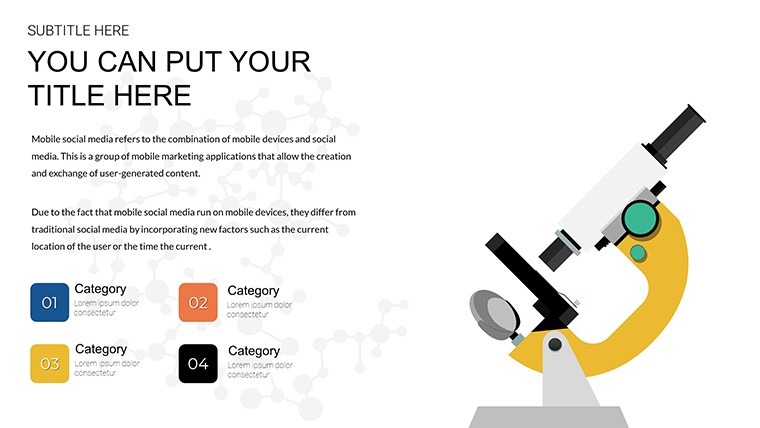
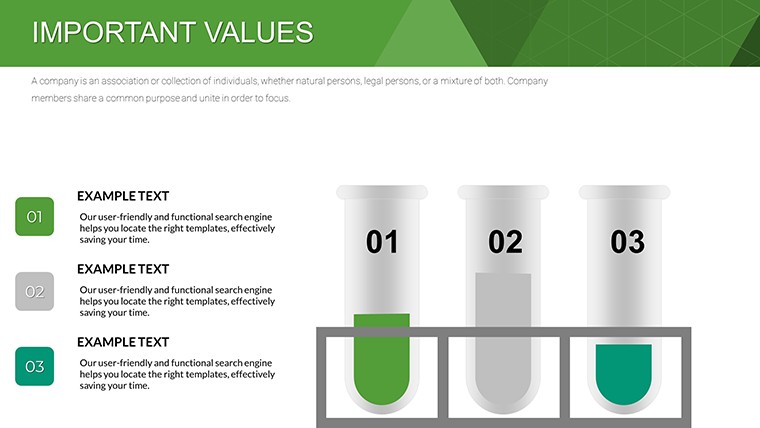
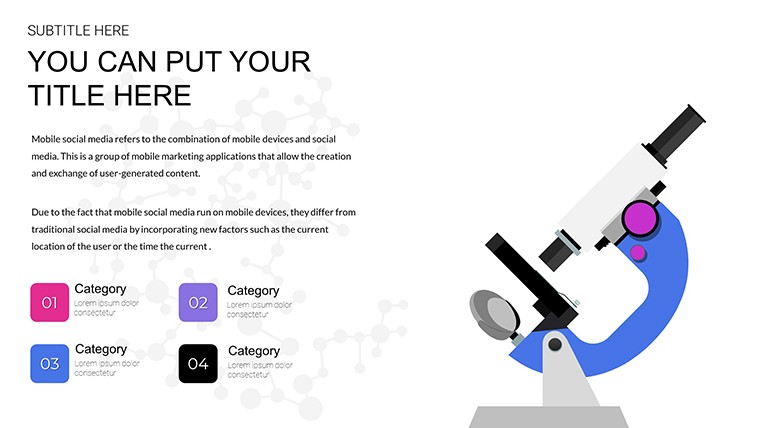
- Multiple editable flowchart layouts for chemical processes
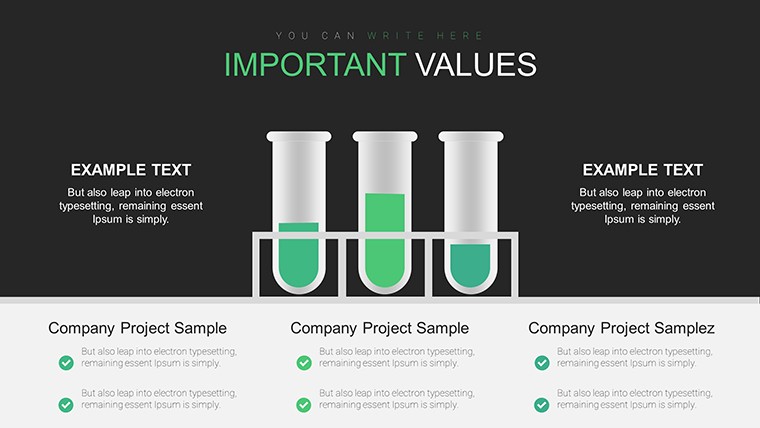
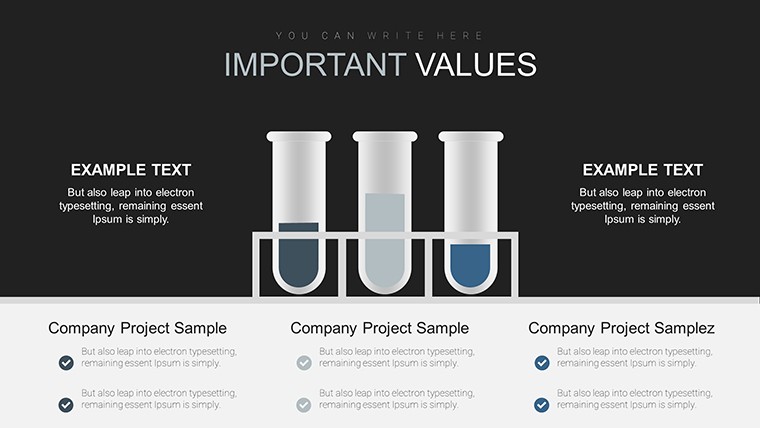
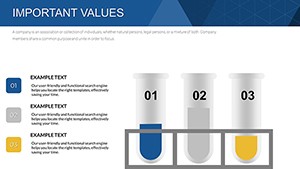
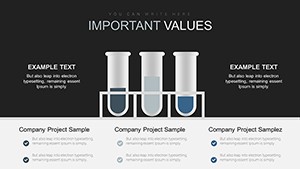
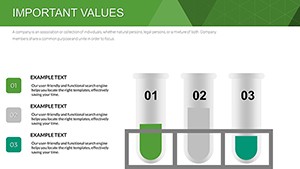
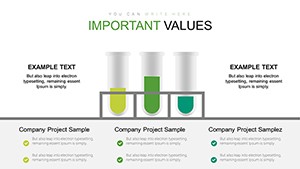
- Dedicated placeholders for reagents, conditions, and results
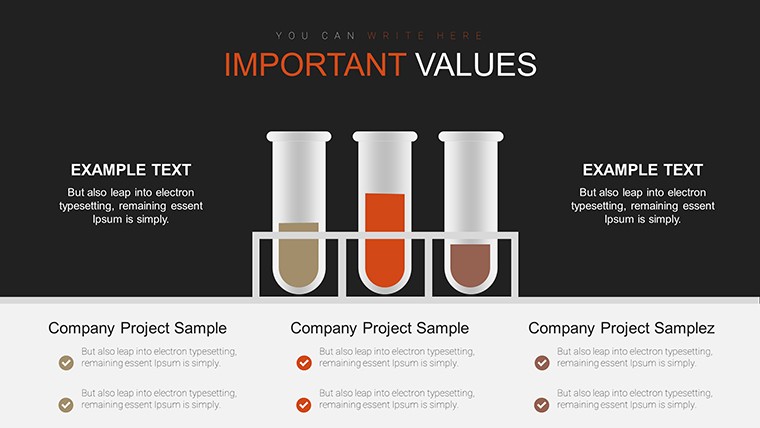
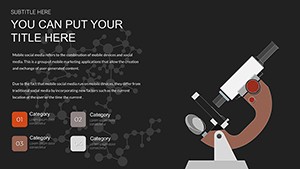
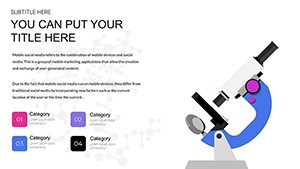
- Professional color schemes optimized for science visuals
- Compatible with Microsoft PowerPoint and Google Slides
- High-resolution elements for clear projection and print
Benefits of Chemical Process Flowcharts
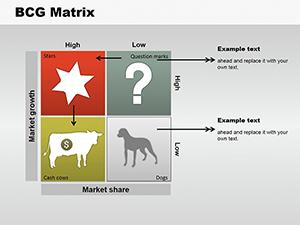
Chemical process flowcharts transform complicated experimental procedures into clear, sequential visuals that audiences can follow easily. They highlight critical stages and relationships, improving comprehension in technical presentations. This structured approach is essential for accurate communication in scientific and industrial settings.
The template's balanced spacing and annotations support detailed explanations while maintaining visual clarity during presentations.
How to Use This Template
Download the .pptx file and open in your preferred software. Fill placeholders with your specific reagents, conditions, and outcomes, adjust colors if needed, and modify the flow to match your process. The design supports straightforward customization for any chemical test scenario.
Customization Tips
- Update block content for accurate stage representation
- Add chemical equations or annotations
- Adjust arrow flows for complex procedures
Professional Scenarios
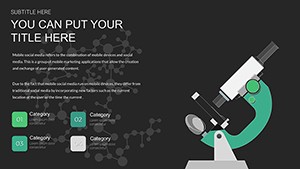
Researchers present experimental methodologies at conferences or lab meetings. Educators illustrate chemical reactions and test procedures in lectures. Pharmaceutical and chemical industry professionals visualize R&D processes for stakeholders. Consulting firms use them to explain science-based recommendations to clients.
Download this free chemical process flowchart template now to enhance your scientific presentations.
Frequently Asked Questions
Is this chemical process flowchart template free?
Yes, the template is completely free for personal and commercial use with instant download.
What software does it work with?
The .pptx format is fully compatible with Microsoft PowerPoint and Google Slides.
Can I edit the process blocks and flows?
Yes, all elements including blocks, arrows, text, and colors are fully editable.
Is it suitable for scientific presentations?
Yes, the professional design and clear structure are optimized for laboratory, research, and educational use.
Is the template print-ready?
Yes, all elements are high-resolution for both digital and printed materials.