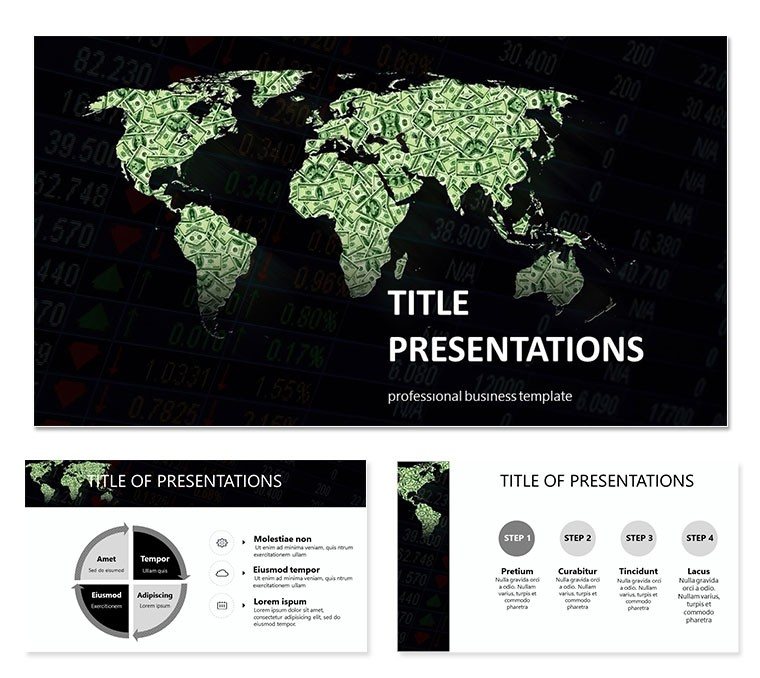
Navigating the interconnected web of global economics demands presentations that map out opportunities as vividly as a world atlas. With international trade volumes expected to hit $28 trillion in 2025, per IMF projections, finance leaders need tools that illuminate trends across borders. The World Map Dollar PowerPoint Template does just that: overlaying dollar motifs on geographic visuals to craft slides that make macroeconomic data accessible and actionable.
Tailored for business pros and educators, this template`s 28 diagrams turn spreadsheets into strategic stories. Backed by PowerPoint 2016+ compatibility and a single-purchase lifetime license, it`s your ally for repeated use in high-impact scenarios.
Key Features of the World Map Dollar PowerPoint Template
- 28 Geo-Finance Diagrams: Choropleth maps for GDP comparisons and bubble charts for trade balances.
- 7 Thematic Color Schemes: Currency greens, neutral globals - adapt to any report`s tone.
- 3 Masters and Backgrounds: Seamless world map integrations for thematic unity.
- Data Visualization Tools: Built-in charts, graphs, and tables ready for Excel imports.
- Easy Customization: Resize continents or tweak dollar icons without distortion.
These assets ensure your deck isn`t just informative - it`s globally resonant.
Detailed Slide Descriptions and Workflow Integration
The hero slide merges a world map with rising dollar arrows, ideal for intro forecasts. Slides 1-9 cover regional analyses, like donut charts per continent for market shares - link to World Bank APIs for live updates via PowerPoint add-ins.
Slides 10-18 tackle investment flows with Sankey diagrams tracing capital paths; paste IMF data for instant refresh. Conclude with 19-28`s scenario planners, using slider controls for what-if projections. Finance teams report 45% quicker global report assembly with such integrations.
Real-World Applications and Use Cases
Business execs shine in strategy sessions, using export trend maps to justify expansions into Asia. For education, econ professors illustrate currency fluctuations with animated overlays, aligning with 2024`s volatile forex lessons.
Research papers at Davos-style forums leverage the GDP heat maps, citing 18% emerging market growth. Sales in investment banking? Tailor dollar flow slides to client portfolios, sealing multimillion deals.
Why Choose This Over Default PowerPoint Tools?
| Feature | Default PowerPoint | World Map Template |
|---|
| Map Integration | Static images | Interactive geo-diagrams |
| Data Handling | Basic imports | Advanced chart formulas |
| Scheme Options | Limited | 7 finance-tuned |
| Visual Impact | Plain | Dollar-themed motifs |
| Scalability | Fixed sizes | Vector scalability |
Go beyond basics to borderless brilliance.
Elevate your global narrative - download the World Map Dollar PowerPoint Template immediately.
Frequently Asked Questions
How accurate are the world map projections?
Based on standard Mercator with editable vectors for custom views.
Can I import live economic data?
Yes, via PowerPoint`s data links to sources like Excel.
Is it suitable for educational use?
Perfectly - lifetime license covers classrooms worldwide.
What if I need non-dollar currencies?
Swap icons easily for euro or yen adaptations.
Does it support animations for trends?
Yes, phased reveals for time-series data.
Are tables included for detailed stats?
Absolutely, with sortable formats for deep dives.
Chart the course to success with maps that matter. Acquire yours today and conquer global finance.