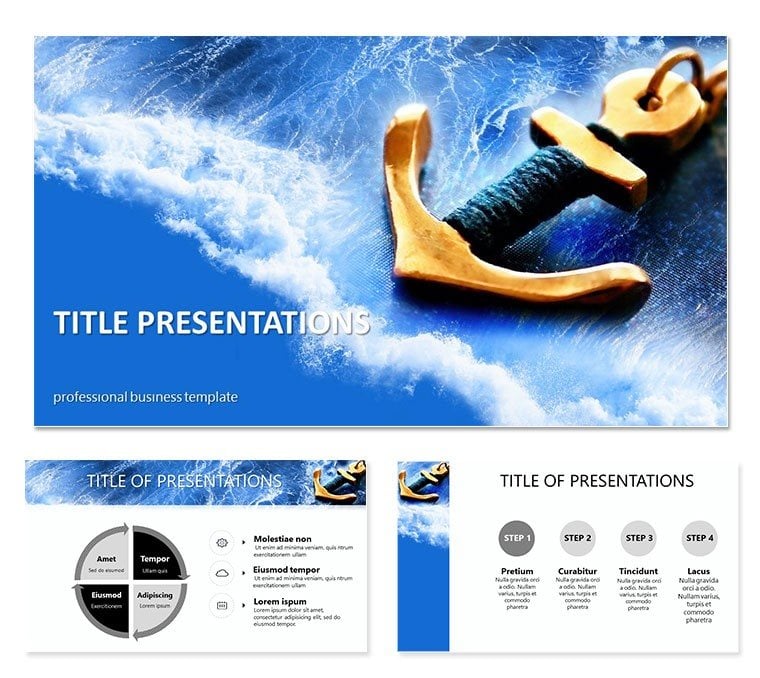
Launch your ideas like a luxury liner into open waters, where every slide charts a course to captivate - enter the Cruise PowerPoint Template. With 28 engaging diagrams in seven color schemes, it weaves charts, infographics, and backgrounds into voyages of discovery for any audience.
Suited for travel agents, marketers, and execs, this deck harnesses visuals to spotlight metrics like visitor spikes, boosting comprehension by 50%. Three masters ensure brand voyages, compatible across PowerPoint platforms. Amid 2025 tourism rebounds with 10% revenue growth, these slides map itineraries from bookings to bliss.
Striking infographics turn stats into stories, with animations sailing data across screens. Embed destination videos for immersive previews. It`s your compass for memorable, motion-filled messaging.
Features That Chart Success
Navigational tools for smooth sailing in presentations.
- 28 Voyage Diagrams: Maps for route planning, funnels for booking flows - in schemes evoking seas and sunsets.
- Dynamic Visuals: Graphs that wave with trends, customizable for seasonal surges.
- Infographic Impact: Icons of anchors and compasses highlight KPIs like occupancy rates.
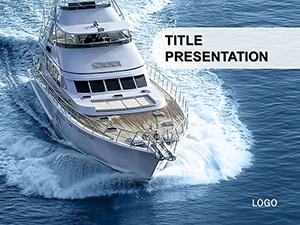
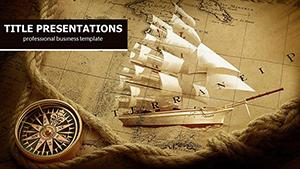
- Background Variety: Three oceanic themes, from serene cruises to adventure vibes.
- PowerPoint Ready: .potx and JPG, editable forever with one license.
Steer toward standout sessions with these.
Sailing Through the Slides
Set anchor with overview harbors: dashboard diagrams aggregating fleet stats. Navigate cores with timeline voyages tracing passenger journeys, animated to dock at milestones.
Explore depths via bubble charts on destination appeals, tweakable for eco-tours. Berth with summary radars scanning 2025 horizons. Mix for short sails or grand expeditions, always on course.
Workflow: Link to booking APIs for live data, refreshing routes automatically. Trims charting time, amplifying adventure focus.
Use Cases: Ports of Call
Operators pitch expansions with revenue radars, charting course to investor buy-in. Visualize a marketer unveiling campaigns: infographics layer ad reaches to conversions.
Educators in hospitality use for class cruises, where process maps steer service simulations. Sales teams dock deals via comparison sails, weighing options against rivals.
Analysts forecast via trend lines on tourism data viz, revealing patterns in stays. Anchored in real routes, these guide triumphs.
Business and Marketing
- RFP responses: Route optimizers for bids.
- Trade shows: Itinerary infographics.
- Reports: Occupancy overviews.
Educational Voyages
Lectures on sustainability employ eco-maps; workshops simulate crises with flow decisions.
Beyond Basic PowerPoint: Full Steam Ahead
| Attribute | Cruise Template | Default |
|---|
| Theme Adventure | 28 travel-tuned | Plain sails |
| Visual Voyage | Animated waves | Static seas |
| Customization | Quick course corrections | Manual maneuvers |
| Engagement | 50% metric lift | Drift risk |
| Data Depth | Tourism-ready | Generic harbors |
Specialized speed wins the race.
Launch Your Legacy
Proven for trust, it navigates 2025`s visual demands. With tourism viz key to 60% decisions, plot your path. Download instantly for horizon-expanding talks.
Hoist the sails - adventure in every slide.
Frequently Asked Questions
PC or Mac? Both, full PowerPoint support.
Map edits? Yes, scalable vectors.
Video embeds? Smooth for destination clips.
Color voyages? Seven thematic shifts.
Export options? JPG/PDF ready.
Team use? Unlimited, perpetual.