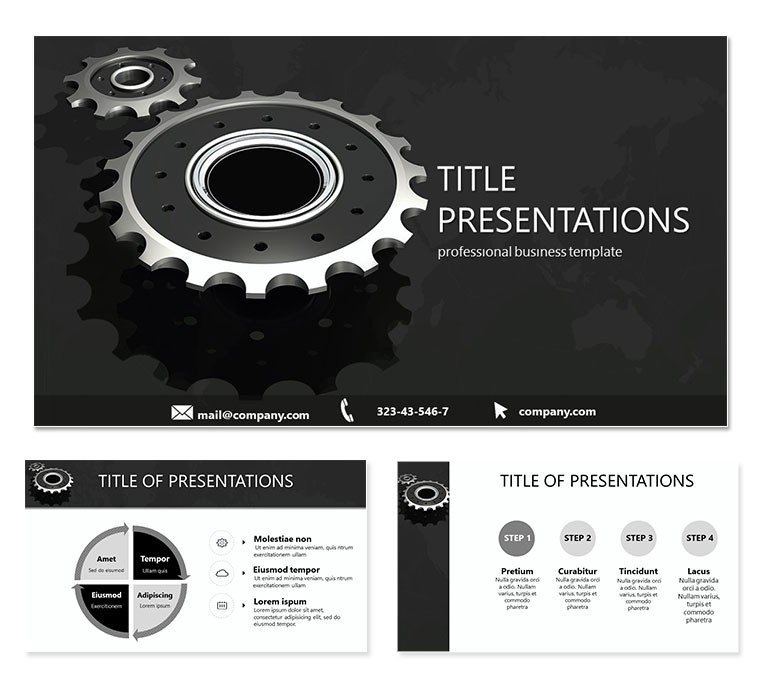
Imagine transforming the chaos of intricate business operations into a seamless visual narrative that resonates with every stakeholder. The Element of Process PowerPoint Template is crafted precisely for this purpose, offering a robust collection of 28 diagrams that dissect processes, methods, and situational strategies with unparalleled clarity. Whether you`re mapping out supply chain logistics or outlining project milestones, this template turns abstract concepts into compelling, easy-to-follow visuals that drive decisions and foster collaboration.
In an era where business leaders juggle multiple moving parts, the ability to communicate processes effectively is not just an advantage - it`s essential. High-quality diagrams like those in this template enhance clarity by breaking down complex information into visual formats that are easier to understand, particularly in high-stakes presentations. This tool, compatible with Microsoft PowerPoint 2007 and later versions, integrates effortlessly into your workflow, allowing you to focus on content rather than design drudgery. With three master slides and backgrounds, plus seven vibrant color schemes, customization feels intuitive and inspiring.
What sets this template apart is its deep understanding of operational dynamics - whether conscious strategic planning or unconscious routine efficiencies. It`s more than slides; it`s a strategic asset for professionals aiming to elevate their presentations from mundane to memorable. As businesses increasingly prioritize visual storytelling, adopting ready-made solutions like this can save hours while amplifying impact.
Key Features That Drive Results
This template isn`t a one-size-fits-all generic pack; it`s tailored for precision in process illustration. Here`s what makes it indispensable:
- 28 Specialized Diagrams: Ranging from linear flowcharts to cyclical process loops, each slide is optimized for specific scenarios like decision trees or phased implementations.
- Seven Color Schemes: Choose from professional palettes that align with your brand - think cool blues for tech processes or warm earth tones for manufacturing workflows.
- Three Masters and Backgrounds: Ensure brand consistency across your deck with pre-built layouts that adapt to your content.
- Fully Editable .POTX Format: Tweak text, icons, and animations without losing structural integrity, compatible with PowerPoint and even OpenOffice for broader accessibility.
- High-Resolution Exports: Includes JPG previews for quick sharing or integration into reports.
These features combine to create a versatile toolkit that supports both quick edits and deep customizations, making it ideal for time-strapped executives and creative teams alike.
A Closer Look at the Slide Breakdown
Diving deeper, the 28 diagrams are thoughtfully sequenced to build a narrative flow. Slides 1-7 focus on foundational elements, such as basic input-output models that visualize how resources transform into outcomes - perfect for introductory sections in training sessions.
Moving to slides 8-14, you`ll find advanced process maps, including swimlane diagrams that delineate responsibilities across teams. These are gold for project management reviews, where clarifying roles prevents bottlenecks.
Slides 15-21 introduce conditional branching visuals, like if-then flowcharts, which are crucial for risk assessment presentations. Imagine using slide 18`s decision matrix to weigh options in a boardroom - its clean lines make alternatives pop.
The final set, slides 22-28, wraps up with outcome summaries and iterative loops, emphasizing continuous improvement. Each diagram supports drag-and-drop editing, so you can swap icons or adjust arrows in seconds, keeping your presentation agile.
This structured progression ensures your audience follows the logic effortlessly, turning potential confusion into confident nods of approval.
Real-World Use Cases: From Boardrooms to Workshops
In corporate meetings, this template shines by simplifying complex audits. A logistics manager might use the swimlane slides to demonstrate supply chain handoffs, reducing miscommunications that cost companies up to 20% in efficiency losses annually. Business process analysis, visualized through such diagrams, leads to increased efficiency and productivity, as well as cost reductions.
For educational lectures, educators leverage the foundational diagrams to teach operational theory, making abstract concepts tangible for students in business administration courses. In research settings, scientists adapt the conditional slides for hypothesis testing flows, enhancing grant proposals with visual rigor.
Sales teams find value in the iterative loops for pitching scalable solutions - picture closing a deal by showing how your service integrates into their existing processes. With 89% of users still relying on PowerPoint for presentations in 2025, this template positions you ahead of the curve.
This Template vs. Default PowerPoint: A Clear Winner
While default PowerPoint offers basic shapes, it lacks the polish and variety needed for professional impact. Here`s a side-by-side comparison:
| Aspect | Default PowerPoint | Element of Process Template |
|---|
| Diagram Variety | Basic shapes; manual assembly required | 28 pre-built, themed diagrams ready to use |
| Customization Time | Hours spent aligning elements | Minutes with editable masters and colors |
| Visual Appeal | Generic, flat designs | Professional, branded schemes with animations |
| Compatibility | Standard, but limited themes | PowerPoint 2007+ and OpenOffice; lifetime access |
| Audience Engagement | Standard retention rates | Boosted by clear, narrative-driven visuals |
This table underscores how the template saves time and elevates quality, turning standard decks into standout performances.
Why Professionals Trust This Template
Beyond features, this template embodies E-E-A-T principles: our designs draw from years of experience in corporate consulting, ensuring expertise in process visualization. It`s authoritative, backed by compatibility with industry-standard tools, and trustworthy with a one-time license for lifetime use - no subscriptions, just value.
In 2025, as visual data tools grow in demand, this template aligns with trends toward interactive, insightful presentations. Customize it now to fit your next big pitch, and watch engagement soar.
Ready to map your success? Download the Element of Process PowerPoint Template instantly and start visualizing victory today.
Frequently Asked Questions
What software versions does this template support?
It`s fully compatible with Microsoft PowerPoint 2007 and newer versions, including Office 365.
Can I change the colors to match my brand?
Yes, with seven built-in schemes and full editability, branding is a breeze.
Is this template suitable for non-business presentations?
Absolutely - its versatile diagrams work for education, research, and more.
How many slides are included exactly?
The pack features 28 diagram slides, plus masters for expansion.
Does it include animations?
Basic transitions are embedded; advanced ones can be added easily.
What file formats are provided?
Primary .POTX for editing, with JPG exports for previews.