Web analytics might seem like a black box to many, but with the right tools, it becomes a powerhouse for uncovering user behaviors and optimizing digital strategies. This Web Analytics PowerPoint template cuts through the mystery, offering a suite of specialized slides that make metrics pop. Geared toward IT specialists and e-commerce managers, it turns raw data into strategic gold, aligning perfectly with 2025`s emphasis on data-driven decisions where analytics inform 72% of marketing budgets.
Envision walking into a stakeholder meeting armed with crystal-clear visualizations of traffic flows and conversion funnels - this template makes it reality. Compatible with PowerPoint from 2016 up, its lifetime license ensures ongoing value. Explore its depths to discover how it simplifies even the most abstract internet industry concepts.
Standout Features for Data Pros
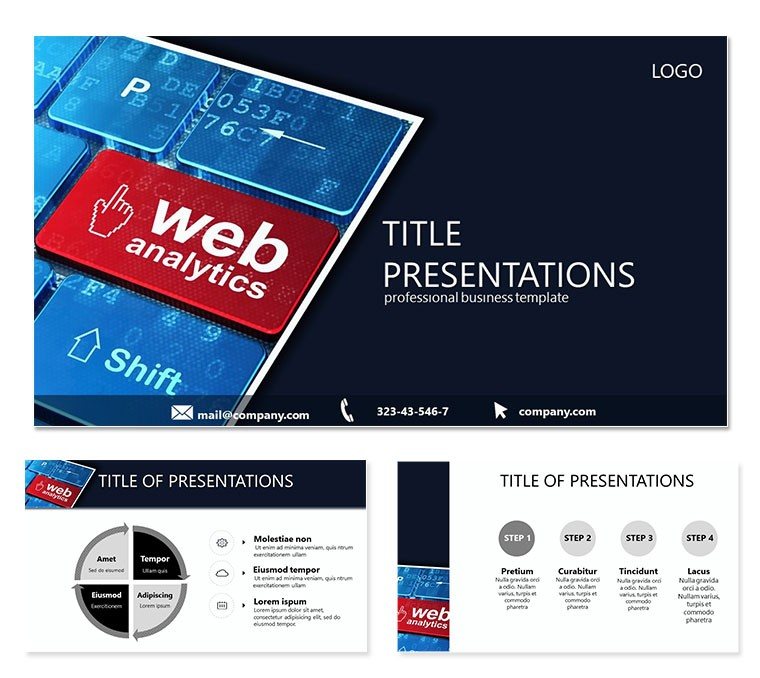
Infused with a sleek, tech-forward aesthetic - think matrix grids and pulse lines - this template prioritizes precision. Three masters lay the groundwork for uniform styling, complemented by backgrounds that subtly nod to digital dashboards without overwhelming content.
- 28 Analytics-Focused Diagrams: Heat maps for user heat zones to Sankey flows for path analysis, all scalable for any dataset size.
- 7 Versatile Color Schemes: From monochromatic for reports to contrasting hues for dashboards, adapting to your brand`s digital palette.
- Effortless Customization: .potx sources enable one-click edits, with layered groups for targeted tweaks.
- Responsive Design: Handles 4:3 and 16:9 ratios, ideal for diverse presentation formats.
Beyond looks, it`s engineered for functionality, accelerating your workflow from data import to audience wow.
In-Depth Slide Tour
Spanning 28 pages, the diagrams cater to every analytics angle. Page 1 launches with a cohort analysis wheel, segmenting user retention over time - essential for subscription models. Advance to Page 6`s bounce rate radar, a circular plot that pinpoints drop-off culprits with pinpoint accuracy.
Core pages 11-20 unpack funnel breakdowns, with stacked cascades revealing abandonment stages, prepped for A/B test overlays. Closing with Pages 24-28`s predictive trend lines, incorporating forecast bands to project future metrics, all animated to unfold insights gradually.
Workflow-wise, import CSV files into charts via PowerPoint`s tools, then fine-tune axes and legends. This setup fosters collaborative edits, perfect for team reviews on campaign performance.
Use Cases in IT and E-Commerce
E-commerce teams harness it for quarterly performance deep-dives, where visuals clarify cart recovery rates, boosting conversions by up to 15% per industry benchmarks. In education, professors illustrate analytics evolution, using slides to trace the field`s growth from web logs to AI insights.
Corporate IT briefings thrive on its capacity to map network latencies, with one analyst crediting it for faster approvals on infrastructure upgrades. Sales pitches gain traction by quantifying lead quality, transforming numbers into narratives that close deals.
Comparing to Vanilla PowerPoint
Default options handle simple graphs but stumble on analytics complexity, often resulting in pixelated imports.
| Element | This Template | Default PowerPoint |
|---|
| Analytics Visuals | 28 specialized plots | Standard charts only |
| Scheme Variety | 7 data-optimized colors | Limited defaults |
| Master Layouts | 3 analytics-ready | Basic template |
| Data Integration | Seamless linking | Manual entry |
| Visual Impact | Animated transitions | Static by default |
It`s the upgrade your analytics game needs.
Elevate your insights - secure this Web Analytics template instantly and decode data like never before.
Frequently Asked Questions
How does it support real-time data? Through linked Excel embeds, updating slides dynamically during live sessions.
Compatibility across versions? Yes, from 2016 to latest, with full feature retention.
Best for e-commerce specifics? Tailored funnels and traffic diagrams shine in sales tracking.
Customization depth? Full vector editing for logos and metrics.
Commercial viability? Lifetime license covers all business uses.
Export options? High-res PDF and video for sharing.