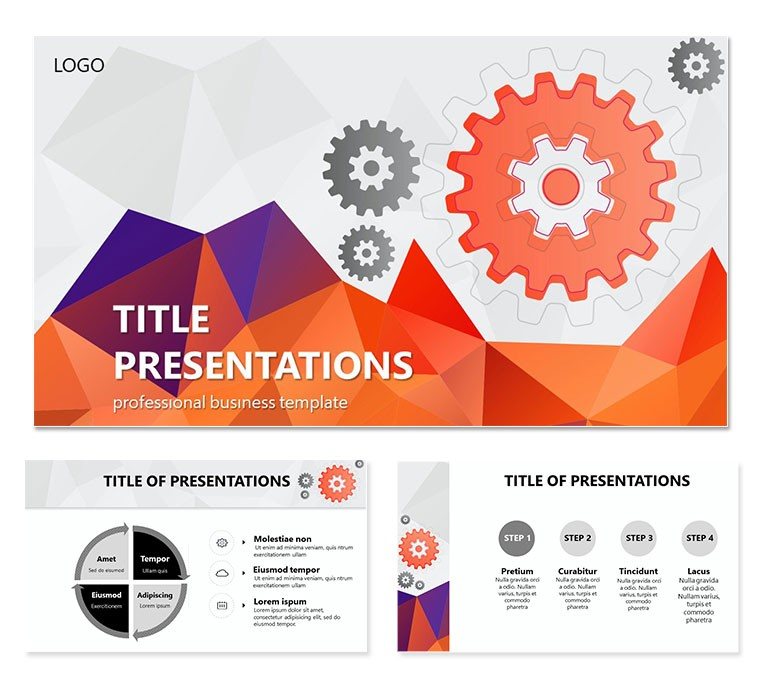
Navigating the loops of business evolution demands visuals that loop in clarity. These Development Cycle PowerPoint templates, with 28 diagrams in 7 color schemes, three masters, and three backgrounds, are for consultants charting fund flows and project evolutions. They cyclical diagrams make iterative processes intuitive.
From inception to iteration, edit cycles to reflect agile loops or waterfall cascades. A consultant used the spiral diagram for product roadmaps, spiraling features outward to show maturity.
Building Blocks: Cyclical Customization
Diagrams loop seamlessly - gears for interlocking phases, orbits for recurring audits. Masters for phase overviews; backgrounds textured for depth.
- Cycle Icons: Arrows, wheels, recursions.
- Scheme Cycles: Seven, from sequential to radial.
- Edit Loops: Infinite scalability.
PowerPoint 2016+, JPG exports.
Cycling Through Diagram Designs
The feedback loop slide circles inputs to outputs. Adjust nodes for milestones.
- Define cycle stages.
- Link elements dynamically.
- Color phases distinctly.
- Animate rotations.
Financial advisors cycle asset allocations visually.
Cycle Applications: Business to Consulting
Project managers loop sprints; financiers trace capital cycles. Iterative insights abound.
Cycle Tips
Break loops into segments. Download for $22.
Frequently Asked Questions
Cycle types?
Loops, spirals, gears.
Data integration?
Excel-linked.
Masters?
Three for phases.
Animations?
Built for flow.
Consulting fit?
Ideal for processes.