Navigate the volatile world of currencies with the Dollar Exchange Rate PowerPoint Template, your anchor in financial seas. This astute design deciphers exchange fluctuations into insightful visuals, empowering economists, traders, or bank execs to forecast and persuade with precision. From plotting USD vs. EUR swings to modeling hedging strategies, it steadies your narrative amid market turbulence.
For finance pros seeking reliability, it`s tuned for PowerPoint 2016+, delivering crisp edits on desktops or laptops alike. Turn data deluges into directed decisions.
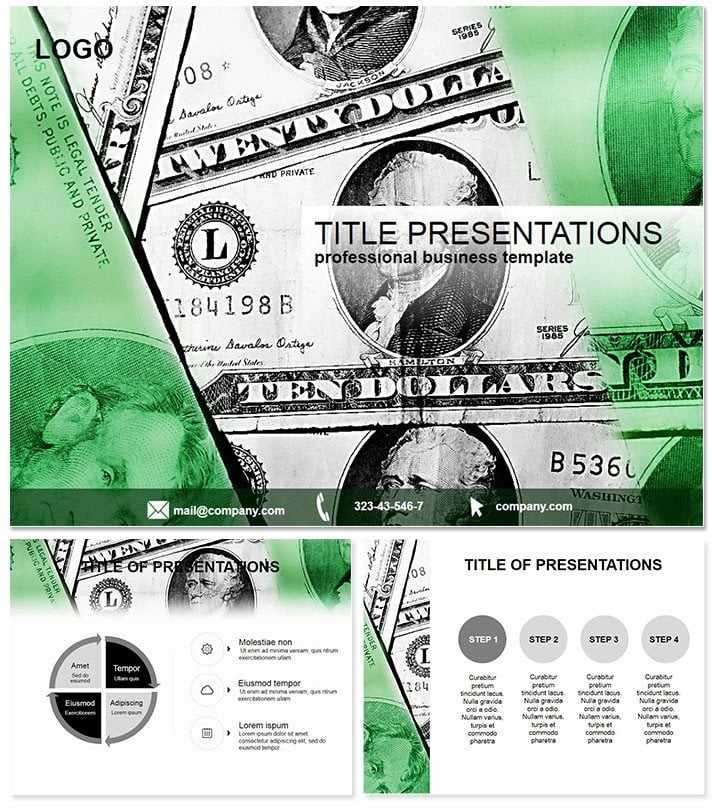
Currency-Strong Features at Your Fingertips
Anchor with three masters for fiscal uniformity, three backgrounds mimicking market tickers, and 28 diagrams in seven schemes - greens for gains, reds for risks.
- Precise Scalability: Stretch lines for long-term trends or cluster pies for multi-currency pies.
- Cross-Platform Poise: Seamless on Windows/Mac, with Google Slides harmony.
- Perpetual Portfolio: Buy once, trade forever - no expiration on insights.
These fortify your fiscal firepower.
Charting the Course: 28 Slide Deep Dive
Slide 1`s line graph baselines historical rates, undulating paths tracking dollar dominance over decades.
Bar clusters (2-5) compare quarterly volatilities, stacks rising with inflation ties. Pie breakdowns (6-9) slice global reserves, wedges weighted by holdings.
Flowcharts (12-15) route trade impacts, arrows from tariffs to tickers. Timelines (18-21) milestone Fed decisions, pegs pinning policy pivots.
Gauges (24-27) dial current strengths, needles negotiating neutral zones. Cycles close with forex loops, reinforcing rate rhythms.
It`s a bullish blueprint for balance sheets.
Market Moves: Targeted Use Scenarios
Investment seminar? Line slides forecast portfolios, peaks predicting profits. Auditors leverage pies for asset allocations, portions proving prudence.
For policy briefs, flowcharts dissect Brexit effects on pounds-to-dollars. Consultants use timelines for client histories, tailoring advice to arcs.
From boardrooms to briefings, it hedges against hazy handouts.
Superior to Stock Slides: The Fiscal Upgrade
Plain PowerPoint peddles primitives; this trades in tailored trends, halving hassle while doubling depth. Vectors vector victory over voxels, schemes shifting sentiments swiftly.
Finance-forged expertise, OS-authoritative, edit-enduring trust. Invest in it now for returns in relevance.
Frequently Asked Questions
Ideal for exchange rate talks?
Yes, with graphs and timelines zeroing on fluctuations for sharp analysis.
Version versatility?
PowerPoint 2016+ across OS, Google-ready.
Edit ease?
Vector-based, tweak trends without trace loss.
Scheme switches?
Seven via masters, market-mood matched.
License longevity?
Lifetime, commercial currency flows free.
Data import tips?
Excel-linkable for live updates, dynamism dialed in.