 Click to zoom
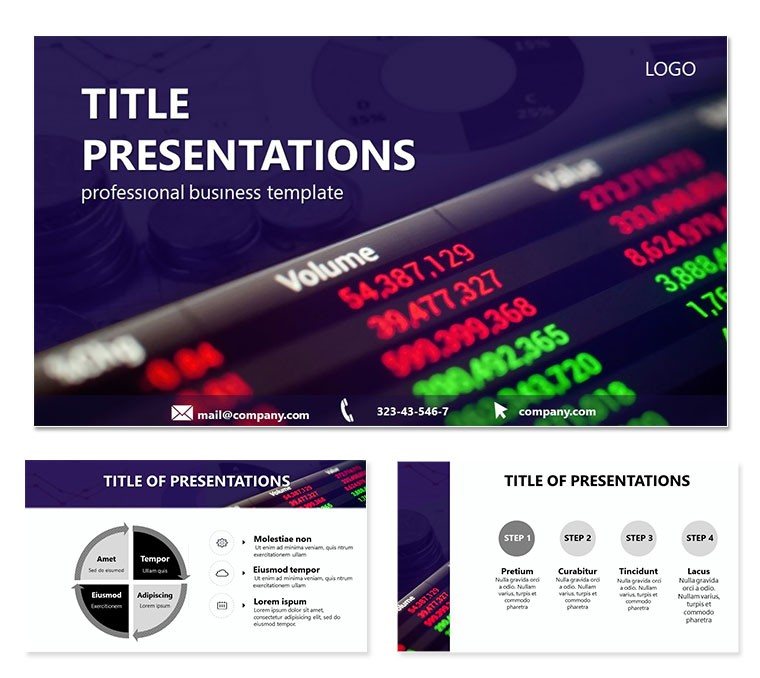
Financial Analysis Software PowerPoint Template: Decode Dollars Dynamically
| Format | .pptx |
| Slides | 3 unique layouts |
| Aspect ratio | 16:9 |
| Compatibility | PowerPoint |
| Animated | No |
| Language | English |
| License | Commercial |
| File size | — |
| Version | v1.0 |
| Last updated | September 2022 |
What's inside
When financial statements demand dissection without discord, the Financial Analysis Software PowerPoint Template steps in as your decoder ring. Tailored for analysts, CFOs, and software devs in finance, it streamlines breakdowns of balance sheets and growth trajectories, ensuring contractors and shareholders see the full picture without the fog. This deck isn`t about crunching numbers - it`s about crystallizing them into conversations that align visions and avert disputes.
With 28 purpose-built diagrams, three masters for analytical arcs, three backgrounds in ledger-line subtlety, and seven color schemes for data distinction, it`s comprehensive. Suited to PowerPoint 2016+, it embraces formulas and links for live updates, keeping your analysis as current as the markets.
Analytical Arsenal: Key Features Unveiled
Masters comprise a ledger-like title, a matrix for deep dives, and a dashboard finale - scaffolding your fiscal tale with precision.
Diagrams dissect: Diagram 1 tallies assets via waterfall, cascades revealing net worth. Diagram 9 scripts a P&L funnel, narrowing to profits. Diagram 23 codes a software ROI matrix, cells computing returns on investment tools.
- Formula-Ready Charts: Embed Excel links for auto-recalculations.
- Clarity Layers: Peelable overlays for scenario what-ifs.
- Audit-Proof Exports: Timestamped PDFs for compliance archives.
Bid adieu to erratic defaults; this template`s rigor fortifies fiscal fortresses.
Blueprint for Building Analysis Decks
- Input Ledger: Feed trial balances; diagrams digest into digests.
- Color-Code Clarity: Assign schemes - crimsons for liabilities.
- Animate Flows: Sequence Diagram 15`s cash flow to pulse quarterly.
- Note Nuances: Script variances, e.g., "Highlight anomaly here."
- Validate Vision: Cross-check with presenter view for stakeholder sync.
This blueprint balances books and bandwidth, distilling data deluges.
Scenarios Where Analysis Aligns All
Software audits use Diagram 5`s dependency graph, nodes netting feature impacts. Board forecasts leverage Diagram 18`s projection lines, extrapolating trends transparently.
Contractor negotiations clarify via Diagram 26`s variance bars, bridging gaps graphically. Dev teams prototype UIs with Diagram 11`s wireframe embeds, funding flows fluidly. It harmonizes the fiscal symphony.
Superior to Stock Spreadsheets
Basic slides scatter stats; this integrates seamlessly, with conditional hues flagging thresholds. Hook to QuickBooks for breaths of fresh fiscal air.
Insight: Sequence reveals gradually to build buy-in, not bombard.
Software Symbols and Sharpening Tips
Icons of calculators and codes punctuate - algorithm-ize Diagram 7 for process parses. Schemes with monotonic scales ensure equitable equity views.
Engage by querying metrics mid-slide, turning talks into two-ways.
Decode decisively - download the Financial Analysis Software PowerPoint Template for $22 and align accounts.
Frequently Asked Questions
Excel integration?
Yes, direct pastes and links for dynamic data.
Version support?
PowerPoint 2016+ across ecosystems.
Compliance ready?
Features for traceable edits and exports.
Custom formulas?
Diagrams host and hide complex calcs.
Team access?
Cloud-shareable for collaborative crunches.
Good for
- Project roadmaps and sprint plans
- Product launch timelines
- Quarterly or annual review decks
- Company history and milestone summaries
Licence
reviews
The audit trail diagram is very thorough for compliance presentations.
Its a great pack for financial analysts.
The balance sheet waterfall chart is much easier to understand than a raw spreadsheet.
I used the P&L funnel to show where our operational costs were eating into profits.
The software roi matrix helped justify our IT budget for next year.
FAQ
Will it work in Google Slides?
Are fonts embedded?
Can I use this for client work?
What's the refund policy?
Do you update the template after purchase?
Similar templates
See all PowerPoint Templates →


All 1 slides