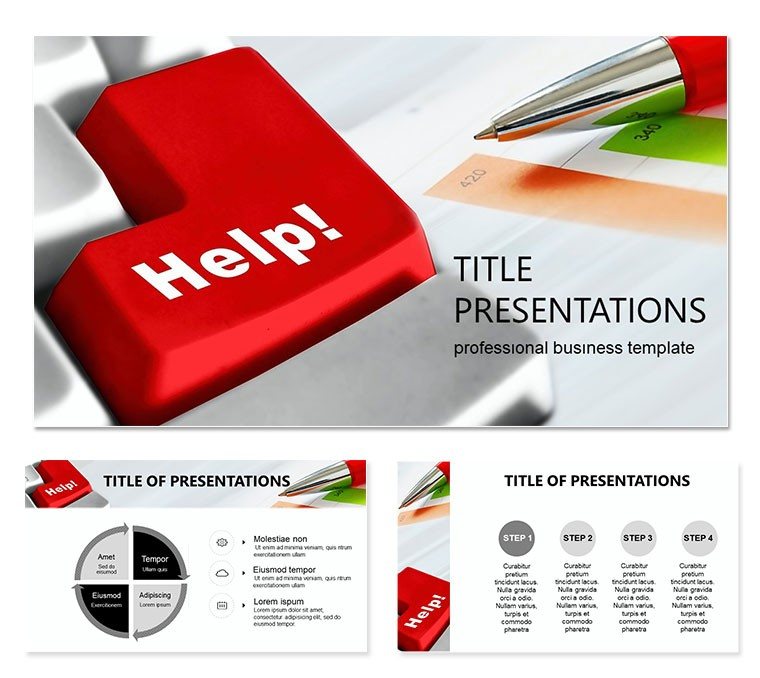
Imagine walking into a boardroom where your slides don`t just display numbers - they tell a story that captivates executives and sparks decisions. That`s the power of our Business Analyst PowerPoint template, designed specifically for professionals who turn raw data into actionable insights. With 28 meticulously crafted diagrams, this template goes beyond basic charts to offer a suite of visuals that simplify complex analyses, from SWOT breakdowns to process flows. Whether you`re a project manager outlining timelines or a consultant pitching strategies, these slides help you communicate with clarity and confidence.
Crafted for compatibility with PowerPoint 2016 and later versions, the template includes three master slides and three background options, allowing seamless integration into your corporate branding. The seven color schemes ensure versatility, whether you`re presenting in a high-stakes client meeting or an internal review. At just $22, it`s an investment that pays off in saved time and heightened impact - download it now to focus on what matters: delivering results that resonate.
Unlocking the Core Features for Effortless Analysis
At the heart of this template lies its user-centric design, built to handle the demands of business analysis without overwhelming you. Start with the intuitive master layouts, which let you swap colors or fonts in seconds, keeping your focus on content refinement rather than design tweaks. The 28 diagrams cover essentials like pie charts for market share breakdowns, flowcharts for operational workflows, and timelines for project milestones - each editable to fit your dataset precisely.
Consider a typical use case: preparing a quarterly performance review. Slide 7, a dynamic Gantt chart variant, allows you to drag and drop milestones, instantly visualizing delays or accelerations. Pair it with slide 12`s infographic-style comparison table, and you`ve got a narrative that highlights efficiencies without a single bullet point overload. These elements aren`t just pretty; they`re practical tools that align with best practices in data visualization, ensuring your audience grasps trends at a glance.
Customization Tips to Match Your Brand
- Color Harmony: Select from seven schemes - cool blues for trust-building financial overviews or vibrant greens for growth-focused pitches.
- Icon Integration: The built-in icon library, themed around analytics gears and charts, adds subtle emphasis without cluttering slides.
- Animation Subtleties: Apply fade-ins to reveal data layers progressively, guiding viewers through your logic step by step.
This level of flexibility means you can adapt the template for diverse scenarios, from agile sprint retrospectives to competitive landscape mappings, all while maintaining a professional polish.
Real-World Applications: From Reports to Pitches
Business analysts often face the challenge of condensing voluminous reports into digestible formats. This template shines here, with slides like the 15th - a radial diagram for stakeholder mapping - that clusters influences visually, making it easy to discuss priorities. In one workflow, input your data via Excel linkage (supported in PowerPoint), then tweak the radial arms to reflect power dynamics, turning abstract concepts into tangible discussions.
For pitches, leverage the funnel diagram on slide 20 to illustrate conversion paths in sales pipelines. Start broad at the top with lead generation stats, narrowing down to close rates - edit the segments to reflect your metrics, and watch as it underscores ROI potential. Professionals in consulting firms have found this particularly useful for client proposals, where visual precision builds credibility from the first slide.
Step-by-Step: Building a Compelling Workflow Slide
- Gather Data: Compile your process steps in a simple list - inputs, actions, outputs.
- Select Diagram: Choose slide 5`s linear flowchart base; duplicate if needed for variations.
- Populate and Edit: Replace placeholders with your text and shapes; resize arrows to show decision branches.
- Enhance Visually: Apply a color scheme that differentiates stages - e.g., orange for risks, blue for approvals.
- Test Flow: Run through presenter view to ensure animations reveal steps logically.
This approach not only saves hours but ensures your presentation flows as smoothly as the processes it describes.
Why This Template Stands Out in Data-Heavy Environments
Compared to standard PowerPoint tools, this template eliminates the guesswork of alignment and scaling, with pre-proportioned elements that stay crisp on any screen. It`s not about flashy effects; it`s about substance - diagrams that support narratives like those in strategic planning sessions, where every visual must justify its space. Integrate it into your toolkit alongside tools like Tableau exports, embedding charts directly for hybrid data stories.
For educators training the next generation of analysts, the template`s modularity allows easy adaptation for classroom demos, such as dissecting case studies from real-world mergers. The result? Engaged learners who see analysis as storytelling, not drudgery.
Ready to transform your next presentation? Download the Business Analyst PowerPoint template for $22 and start crafting slides that drive decisions.
Frequently Asked Questions
What versions of PowerPoint does this template support?
It works with PowerPoint 2016 and newer, including Microsoft 365, ensuring broad compatibility.
Can I customize the colors beyond the seven schemes?
Yes, all elements are fully editable, so you can input hex codes for exact brand matches.
Are the diagrams resizable without losing quality?
Absolutely - vector-based designs maintain sharpness at any scale.
Does it include icons or graphics for data viz?
Yes, a themed library of over 50 icons complements the diagrams.
How do I link external data sources?
Use PowerPoint`s built-in chart tools to connect to Excel for live updates.