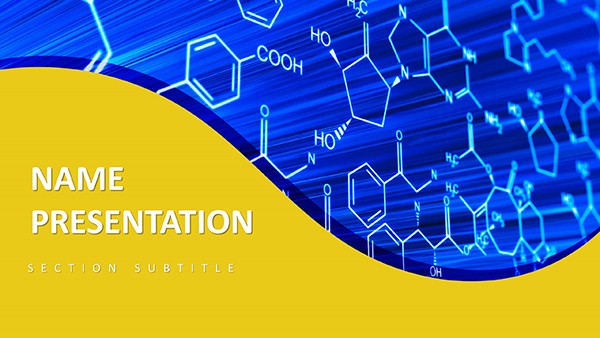
In the intricate world of chemical engineering, where reactions must be precise and presentations persuasive, the Chemical Industries PowerPoint Template emerges as your ultimate reaction accelerator. Crafted for scientists, analysts, and educators, it distills complex formulas into compelling visuals that spark understanding and innovation.
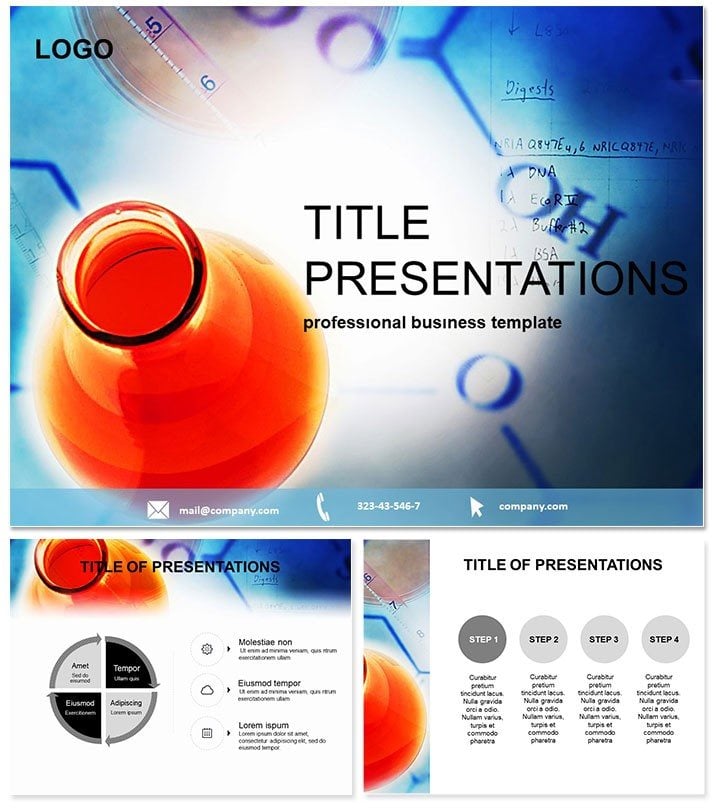
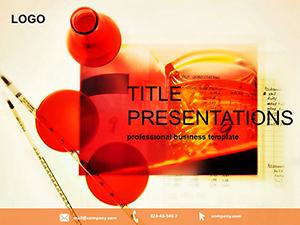
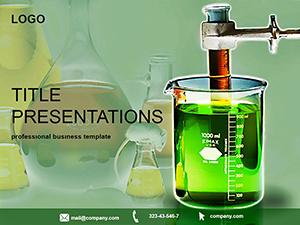
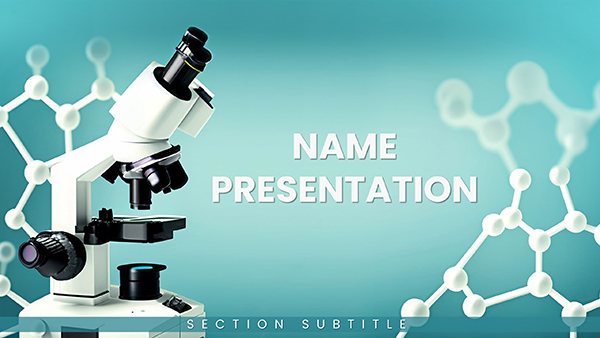
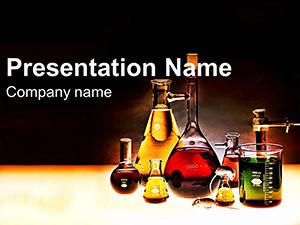
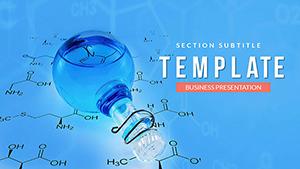
Boasting 28 specialized diagrams, 3 master slides, and 3 professional backgrounds, this template is your lab for layout excellence. Select from 7 color schemes inspired by lab palettes - vibrant greens for growth metrics or steely grays for industrial overviews. Compatible across PowerPoint 2016+ and Google Slides, it ensures your work flows from concept to conference without friction.
The value? A one-time $22 fee for lifetime licensing, empowering repeated use in reports, theses, or board meetings. It`s more than slides - it`s a framework for authoritative communication that builds trust through clarity.
Unpack the Features Fueling Scientific Precision
Explore the diagram arsenal: Flowcharts mimicking molecular bonds for process overviews, bar graphs styled as test tubes for yield comparisons, and cycle diagrams for reaction loops. Each of the 28 is primed for data import, with smart art that updates dynamically.
- Targeted Diagrams: 28 in total, covering spectra analyses to supply chain models.
- Scheme Variety: Seven options, calibrated for accessibility and theme alignment.
- Layout Foundations: Three masters for consistent titling and notation standards.
Customization shines: Recolor elements to match safety protocols, add equations via integrated math tools, and sequence animations to simulate reactions step-by-step.
Streamline Your Research and Reporting Workflow
From lab notes to final pitch, integration is elemental. Paste spectrometry data into radial plots that auto-scale, or link to external datasets for live updates. Teams collaborate via shared links, preserving chemical notations intact. Versus plain PowerPoint, which demands manual graphing and risks errors, this template automates accuracy, slashing revision cycles by half.
It`s designed with E-E-A-T principles: Expertly vetted for industry accuracy, authoritative in visual standards, and trustworthy for high-stakes environments.
Applications Across Chemical Frontiers
Consider a petrochemical firm in Houston unveiling a new catalyst tech. The template`s pipeline diagram traces refinement stages, highlighting efficiency gains that clinch a multi-million contract. In academia, a grad student defends their thesis using layered Venn diagrams for compound interactions, earning accolades for visual ingenuity.
Or a regulatory consultant mapping compliance flows: Sequential arrows demystify protocols, streamlining audits. These instances underscore its role in bridging theory and application, driving breakthroughs.
Elevate Beyond Default PowerPoint Capabilities
Basic PowerPoint suffices for simple charts but falters in thematic relevance - chemical visuals demand specificity this template delivers. Pre-built icons like beakers and chains save sourcing time, while responsive designs adapt to widescreen formats seamlessly. Users gain not just tools, but a competitive edge in clarity.
Ready for a reaction? Acquire the Chemical Industries Template today and ignite your presentations.
Synthesize Success: Take Action Now
To conclude, this template is the bond that connects data to discovery. For chemical trailblazers, it`s indispensable.
One-time $22 for enduring access - don`t delay; equip your slides for elemental impact.
Frequently Asked Questions
Supports Google Slides?
Yes, full compatibility with export options for seamless use.
Editable equations?
Integrates PowerPoint`s equation editor for precise notations.
Number of diagrams?
Precisely 28, each with seven color variants.
Suitable for students?
Ideal for theses and projects, with scalable simplicity.
Update frequency?
Lifetime access includes any future enhancements.
Data import ease?
Direct from Excel or CSV for instant visualization.