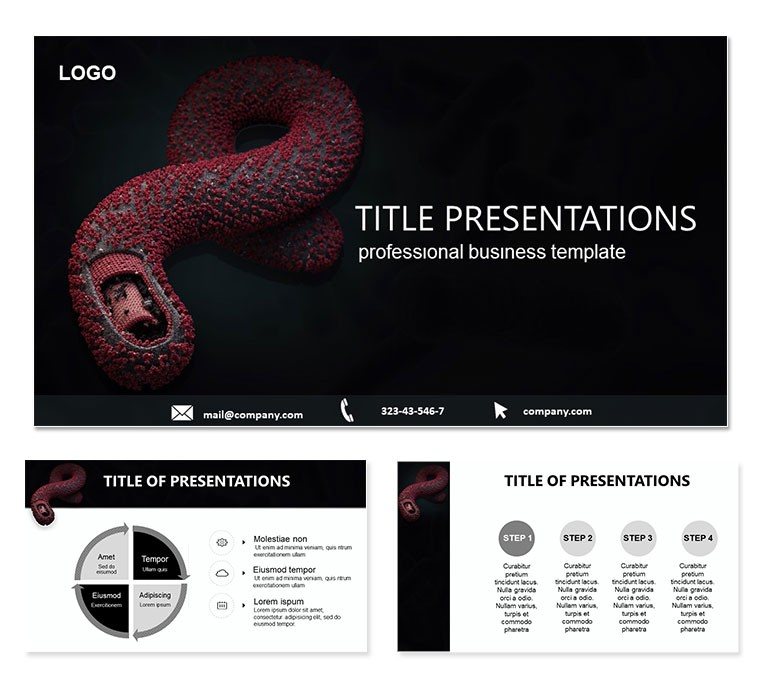
In the high-stakes world of infectious disease research, where every detail of a pathogen`s makeup can unlock breakthroughs, your presentations need to match that precision. Enter our Ebola Virus Structure PowerPoint template - a specialized resource for biologists, virologists, and science communicators who demand visuals as robust as their data. This template unpacks the filovirus family`s genomic RNA intricacies, from antigenic differences in Zaire, Sudan, and Reston strains to the virus`s environmental stability, all across 28 purpose-built diagrams.
Optimized for PowerPoint 2016 and newer, with widescreen (16:9 and 16:10) formats, it supports Windows and Mac workflows alike. Whether you`re dissecting strain variations in a lab meeting or illustrating biochemical properties for a funding pitch, these slides make abstract structures tangible. Envision a 3D-like render of the virion envelope on one slide, editable to layer in your fluorescence microscopy findings, or a side-by-side comparison chart highlighting genetic divergences - tools that elevate your narrative from informative to illuminating.
Essential Features That Define Precision
This template`s strength lies in its forensic-level detail, balanced with user-friendly edits. The three master slides set the stage: one for structural overviews with helical nucleoprotein visuals, another for strain timelines, and a third for stability assays. Complementing them are three backgrounds, ranging from electron-microscope grays to vibrant strain-coded hues, ensuring your deck aligns with journal aesthetics or conference themes.
- 28 Vector Diagrams: Detailed illustrations of filovirus morphology, including envelope glycoproteins and VP35 proteins.
- 7 Adaptive Color Schemes: From monochromatic for print to high-contrast for projections, aiding color-blind accessibility.
- Built-in SmartArt Alternatives: Pre-formatted shapes for RNA genome loops, bypassing clunky defaults.
- Export-Ready Assets: High-DPI .jpgs for reports, with .potx source for full customization.
Such elements tackle common frustrations in scientific slides, like rendering helical structures without distortion. A researcher could tweak Slide 9`s antigenic map to spotlight cross-reactivity data, fostering discussions on vaccine design without rebuilding from vectors.
Guided Workflow: Structuring Your Deck
Launch PowerPoint and load the .potx file - your canvas awaits. Begin by selecting a master; the strain-focused one might suit a seminar on ebolavirus diversity. Then, populate diagrams: Slide 4`s bar graph on biochemical variances comes with axis labels ready for your lab metrics.
- Refine Visuals: Adjust line weights in the virion cross-section to emphasize lipid membranes.
- Incorporate Data: Link Excel sheets to charts for live updates on stability tests.
- Enhance Flow: Add morph transitions between strain slides to simulate evolutionary shifts.
- Test Delivery: Rehearse with notes pane, cueing pauses at key revelations like the virus`s aerosol resilience.
This approach streamlines prep, freeing time for peer review. In a university symposium, adapt Slide 15`s sequence alignment to debate filoviridae phylogeny, integrating FASTA files for authenticity.
Practical Scenarios: Where Structure Meets Strategy
Deploy this template in contexts demanding structural clarity, like biotech investor updates. Use Slide 11`s radial diagram to radiate glycoprotein functions, clarifying therapeutic targets. Or, for journal clubs, the process diagram on Slide 20 maps entry mechanisms, editable for debating receptor bindings.
Spotlight select slides: Slide 2`s overview infographic synthesizes family traits, ideal for intros. Slide 25`s stability timeline charts environmental persistence, a nod to field epidemiologists modeling transmission risks.
Versus vanilla templates, its specialized motifs - like nucleocapsid icons - lend credibility, making your work resonate in Nature submissions or TEDx health talks. Blend with software like BioRender for hybrid visuals, then import seamlessly.
Empower your insights today - download for $22 and structure narratives that advance science.
Frequently Asked Questions
Are the diagrams scalable without quality loss?
Yes, all are vector-based, maintaining sharpness at any zoom or export size.
What slide sizes does it support?
Widescreen 16:9 and 16:10, perfect for modern projectors and laptops.
Can I add my own strain data?
Effortlessly - charts and tables have dynamic placeholders for custom inputs.
Is it compatible with older PowerPoint versions?
Designed for 2016+, but backward-compatible elements ensure broad use.
How do the color schemes enhance presentations?
They differentiate strains visually, improving comprehension in diverse audiences.