 Click to zoom
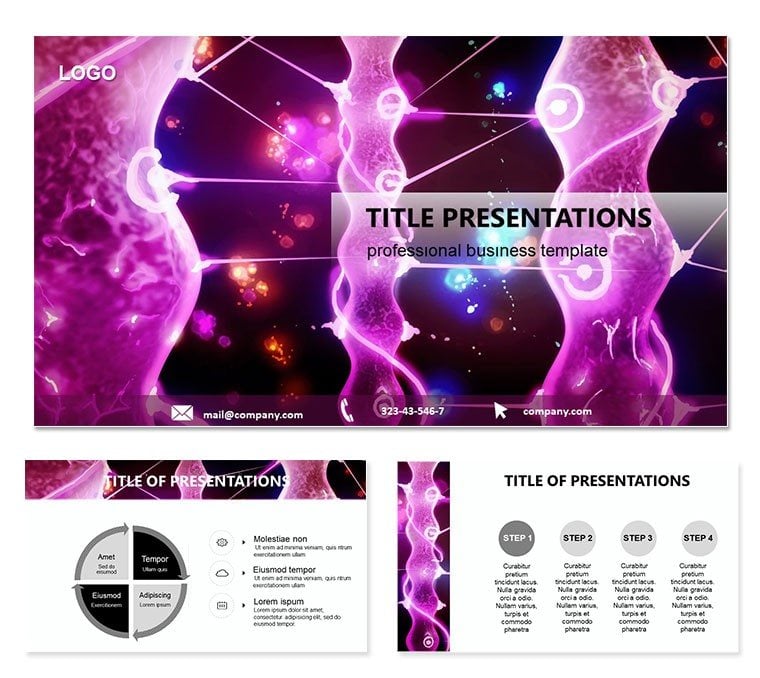
Virus-Host Interaction PPT: 28 Process Maps
| Format | .pptx |
| Slides | 3 unique layouts |
| Aspect ratio | 16:9 |
| Compatibility | PowerPoint |
| Animated | No |
| Language | English |
| License | Commercial |
| File size | — |
| Version | v1.0 |
| Last updated | November 2014 |
What's inside
The dance between a virus and its host cell is a multistep ballet of attachment, entry, and evasion - nuances that, when visualized sharply, can redefine therapeutic strategies. Our Virus-Host Interaction PowerPoint template arms cell biologists, immunologists, and pharma developers with 28 process maps tracing from receptor adsorption to intracellular hijacking, illuminating Ebola`s stealthy incursions.
PowerPoint-native with widescreen versatility, it thrives on desktops or cloud shares. In a virology workshop or drug discovery pitch, these slides orchestrate complexity into flows - picture a sequential cascade animating endocytosis, or receptor cluster diagrams highlighting co-factors, all set for your cryo-EM overlays.
Blueprints for Interaction Mastery
Structured for sequential storytelling, three masters sequence phases: binding for starts, fusion for climaxes, replication for ends. Backgrounds mirror cellular textures, from membrane blues to vesicular pops.
- 28 Process Diagrams: Flowcharts, receptor models, and endosomal paths, precisely layered.
- 7 Process Color Schemes: Phased gradients tracking from attach (green) to invade (red).
- Modular Pathways: Drag-drop segments for alternate routes like macropinocytosis.
- Asset Suite: .potx core, .jpg snaps for papers.
Solving pathway puzzles, a diagram`s fork lets you branch to strain-specific entries, vital for modeling inhibitors.
Navigating the Interaction Blueprint
Import to PowerPoint, choose a master - the fusion one for entry deep-dives. Engage diagrams: Slide 5`s adsorption wheel spins ligands, slots for affinity constants.
- Detail Bindings: Label receptors like DC-SIGN, scaling bonds by strength.
- Animate Invasions: Sequence vesicle fusions with easing curves for realism.
- Integrate Models: Embed PDB viewers as hyperlinks for 3D spins.
- Polish Pathways: Align notes to steps, prepping for mechanism breakdowns.
Effortless for iterations, in a collab lab, revise Slide 12`s penetration schema with fusion peptide tweaks from assays.
Infection Insights: Lab to Lecture
Prime for mechanism seminars, Slide 9`s receptor grid grids affinities, customizable for host ranges. In R&D briefs, the endocytic loop on Slide 24 loops pH drops, forecasting escape blocks.
Standouts: Slide 3`s overview cascade chains all steps, a roadmap anchor. Slide 28`s implication web nets outcomes, tying to immunity.
Superior to sketches, its cyto-icons - like clathrin coats - ground theory, meshing with ImageJ outputs for enriched views.
Decode the duel - download for $22 and chart conquests.
Frequently Asked Questions
Diagrams depict specific Ebola mechanisms?
Yes, focused on filovirus adsorptions and GP-mediated fusions.
Support for animation customization?
Full control over timings and triggers for step-wise reveals.
Editable for other viruses?
Modular, swap icons and labels for broad filoviridae use.
What formats for collaboration?
.potx for PowerPoint, exportable to PDF for annotations.
Include receptor co-factor placeholders?
Dedicated nodes for elements like TIM-1 integrations.
Good for
- Project roadmaps and sprint plans
- Product launch timelines
- Quarterly or annual review decks
- Company history and milestone summaries
Licence
reviews
The stacked bar chart for product mix over time.
I wish there were more built-in data examples.
Had to do a financial analysis and the waterfall chart helped.
My professor liked the clarity of my charts.
The template has some extra elements I had to delete.
FAQ
Will it work in Google Slides?
Are fonts embedded?
Can I use this for client work?
What's the refund policy?
Do you update the template after purchase?
Similar templates
See all PowerPoint Templates →

All 1 slides