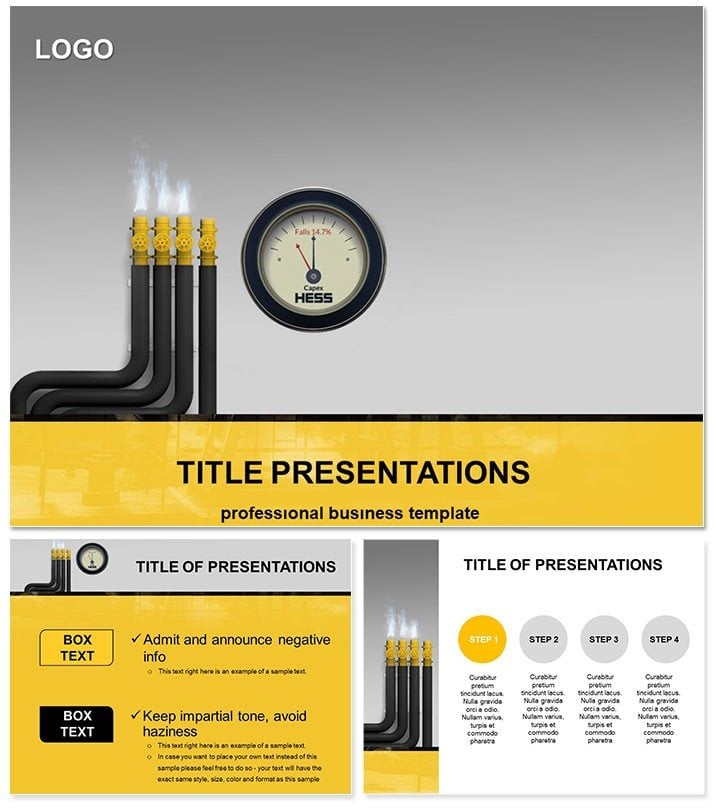
When pipelines stretch across continents, your presentations must flow just as smoothly. The Gas Conduit PowerPoint Template is engineered for industry leaders in production and energy, offering 28 diagrams that trace natural gas from wellhead to end-user. In versatile formats - 16:9 widescreen, 4:3 standard, and 16:10 - this editable powerhouse works with PowerPoint 2016+, turning technical specs into strategic stories. Ideal for engineers briefing on infrastructure or execs negotiating contracts, it demystifies long-haul transmission with precision visuals.
The edge? It tackles the tedium of diagramming ducts and valves, providing pre-built paths that snake through slides like actual conduits. A project manager in renewables adapted it for hybrid gas-renewable hybrids, clarifying routes that won approvals. At $22, it`s a conduit to clearer communication - secure yours today and pressurize your pitches.
Pipework Pillars: Essential Features
Three masters and backgrounds form the frame, with seven color schemes evoking steel grays to cautionary yellows. Diagrams cover everything from linear flows to branched networks.
- Pipeline Schematics: Flowcharts mimicking manifold systems, editable for custom routes.
- Industry Icons: Compressors, valves, and meters in scalable vectors.
- Multi-Format Support: Adapts to any projector ratio without cropping.
- Asset Package: .potx plus JPGs for reports.
These tools transport data efficiently, much like the gas they depict.
Framing the Flow: Master Layouts
Masters standardize headers with engineering fonts, backgrounds textured like terrain maps. Switch schemes to highlight pressure drops in red alerts.
Transmission Trails: Practical Use Cases
From feasibility studies to regulatory reviews, this template fuels focused discussions.
Engineering Project Overviews
- Route Mapping: Sankey diagrams channel gas paths, noting capacities.
- Risk Assessment: Heat maps flag leak zones along the line.
- Timeline Tracking: Gantt bars parallel construction phases.
- Stakeholder Summary: Dashboard aggregating metrics.
Versus plain PowerPoint, it embeds sector shorthand, accelerating buy-in.
Supply Chain Presentations
Visualize sourcing to delivery with tree diagrams, branching suppliers. For global teams, embed hyperlinks to GIS data.
Investment Pitches
Execs use bubble charts to size ROI by segment - a VP once streamlined funding talks with these flows.
Valve Tweaks: Customization Guide
Apply theme, then route edits via SmartArt. Animate flows for dynamic demos, but cap at key junctions to avoid lag. Test in outline view for logical progression.
Draw from pros like urban planners: Use consistent scales for credible claims.
Frequently Asked Questions
PowerPoint compatibility?2016+ versions supported.
Color scheme changes?Design > Colors menu.
Diagram editability?Full vector access.
Format options?16:9, 4:3, 16:10.
General industry fit?Yes, beyond gas.
Files included?.potx, JPG.