Imagine transforming complex e-commerce strategies into crystal-clear visuals that resonate with stakeholders, from boardroom executives to potential investors. This Organization of E-commerce PowerPoint Template is your go-to resource for crafting presentations that not only inform but inspire action. With 28 meticulously designed diagrams, three master slides, and three versatile backgrounds, it`s built to handle everything from market overviews to operational workflows. Whether you`re a digital marketer outlining growth plans or a startup founder pitching supply chain efficiencies, this template turns data dumps into dynamic stories. Compatible with PowerPoint 2016 and later, it ensures seamless editing on both Windows and Mac, letting you focus on your message rather than formatting frustrations.
The beauty of e-commerce lies in its accessibility - anyone with an internet connection can tap into global markets. Yet, conveying that potential in a presentation often falls flat without the right visuals. This template addresses that head-on, offering seven color schemes to match your brand`s vibe, whether it`s vibrant for consumer-facing decks or sleek for B2B reports. Dive into diagrams that map customer journeys, highlight revenue streams, and dissect competitive landscapes, all ready to plug in your data. Picture a slide where funnel stages flow like a digital river, guiding viewers from awareness to purchase without a single confusing arrow. It`s not just about looking good; it`s about making your audience see the path to profitability as clearly as you do.
Essential Features That Drive Engagement
At its core, this template prioritizes flexibility without sacrificing polish. Start with the three master layouts, each optimized for different presentation rhythms: one for high-level overviews, another for deep dives into metrics, and a third for interactive Q&A sessions. The backgrounds - subtle gradients in neutral tones - keep the focus on your content, avoiding the distraction of overly busy designs. And those 28 diagrams? They`re the stars: from pyramid structures breaking down organizational hierarchies to circular flowcharts illustrating payment processes. Each one is vector-based, scaling perfectly without pixelation, and fully editable so you can tweak shapes, colors, and labels in minutes.
- Customizable Color Schemes: Seven options, from cool blues evoking trust to warm oranges signaling urgency, let you align with seasonal campaigns or corporate palettes.
- Diagram Variety: Linear timelines for rollout phases, Venn diagrams for partnership overlaps, and Gantt-style charts for project timelines - tailored for e-commerce realities.
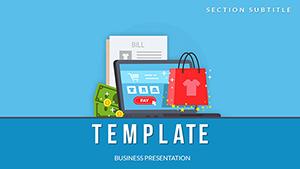
- Asset Integration: Easily embed icons for shopping carts, secure locks, and mobile devices, sourced in high-res JPG for crisp previews.
Think of a real-world application: a logistics coordinator at an online retailer uses the supply chain diagram to demonstrate how optimized routing cut delivery times by streamlining vendor integrations. No more static bullet points; instead, animated paths reveal bottlenecks at a glance. This level of detail empowers you to anticipate questions, like "How does this scale internationally?" with a ready slide showing geo-expansion models.
Step-by-Step Guide to Customizing Your Deck
- Select Your Master: Open the .potx file in PowerPoint and choose the layout that fits your narrative arc - perhaps the overview master for an executive summary.
- Populate Diagrams: Click into the first diagram slide, replace placeholder text with your KPIs, and adjust data inputs for auto-updating charts.
- Apply Colors and Animations: Switch to a color scheme via the design tab, then add subtle fades to reveal elements sequentially, mimicking a shopper`s decision process.
- Incorporate Branding: Swap background elements with your logo or tagline, ensuring consistency across all 28 slides.
- Preview and Refine: Run a slide show to test flow, tweaking transitions for smooth handoffs between sections like "Market Trends" to "Action Plan."
This workflow isn`t guesswork; it`s a proven method echoed in design principles from experts like those behind minimalist infographics in Forbes contributor decks. By the end, your presentation feels less like a report and more like a roadmap to e-commerce dominance.
Real-World Applications for E-commerce Pros
E-commerce isn`t one-size-fits-all, and neither is this template. For a marketing lead preparing a quarterly review, the revenue breakdown pie charts become a canvas for segmenting sales by channel - online vs. app, domestic vs. export. Add layered annotations to highlight trends, turning numbers into narratives that justify budget shifts. Consultants might leverage the organizational hierarchy slides to propose team structures for scaling operations, using branching trees to show reporting lines from C-suite to fulfillment specialists.
In investor pitches, where every second counts, the competitive analysis matrix shines. Populate it with rival metrics, and the visual grid instantly spotlights your edge, like faster checkout times. Or consider compliance training: use process flow diagrams to walk teams through data privacy protocols, ensuring GDPR adherence feels intuitive rather than intimidating. These aren`t abstract ideas; they`re drawn from common pain points in the field, like the rush to visualize Black Friday forecasts without starting from scratch.
Tailoring for Stakeholder Buy-In
To maximize impact, layer in audience-specific tweaks. For tech-savvy VPs, embed hyperlinks in diagrams linking to live dashboards; for creative directors, experiment with icon swaps to evoke brand storytelling. The result? Presentations that don`t just inform but mobilize, much like how Zappos decks use visuals to humanize logistics. Remember, the goal is clarity: each slide should answer "So what?" before the question arises.
As you build, integrate tips like limiting text to key phrases - let diagrams do the heavy lifting. This approach, rooted in effective communication frameworks, ensures your e-commerce vision lands with precision. Ready to organize your ideas into unstoppable momentum? Download this template for $22 and watch your presentations evolve from functional to phenomenal.
Frequently Asked Questions
What file formats are included with the template?
The template comes in .potx for easy editing in PowerPoint and JPG previews for quick references.
Is this template compatible with Google Slides?
While optimized for PowerPoint, you can import the .potx into Google Slides with minor adjustments to animations.
How many color schemes does it offer?
There are seven distinct color schemes, allowing flexibility for different branding needs.
Can I use this for non-e-commerce topics?
Absolutely - the diagrams are versatile for any organizational presentation, like general business strategies.
Does it support animations?
Yes, basic animations are built-in and fully customizable to enhance flow without overwhelming the design.