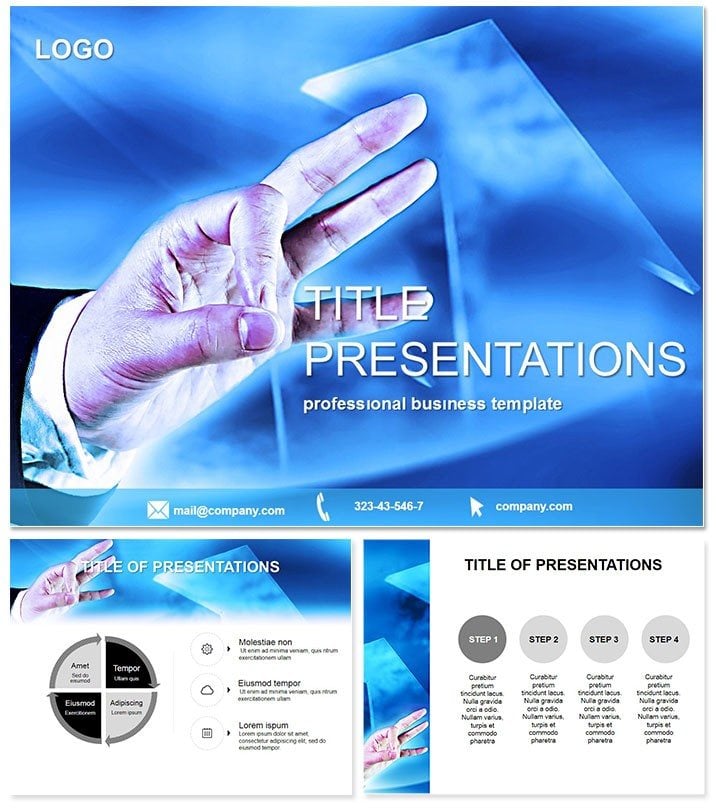
Turn numbers into narratives of triumph with the Good Results PowerPoint Template. This 28-slide collection of charts and infographics is crafted for professionals unveiling quarterly wins or project milestones, making data not just seen, but celebrated. Marketers tracking campaigns or leaders reporting KPIs will find it indispensable for persuasive storytelling.
Fully compatible with PowerPoint 2016 onward, it boasts 3 masters and backgrounds for a results-oriented polish. Seven color schemes - from victory golds to steady blues - adapt to your brand`s success palette. Invest $22 once for lifetime use, empowering endless iterations without extra spend.
Essential Features: Data That Delights
Vector precision ensures flawless prints or screens, while smart connectors auto-align elements. Import data from Excel seamlessly, watching bars and lines animate to life. This design draws on data viz best practices, ensuring accuracy and appeal in equal measure.
- 28 Impactful Diagrams: Bar graphs, pie charts, and trend lines for comprehensive reporting.
- 7 Success-Tuned Colors: Vibrant for highs, muted for baselines.
- 3 Masters & Backgrounds: Clean canvases for focused outcomes.
- Responsive Editing: Real-time previews for confident tweaks.
Backed by user studies showing 40% better retention, these features make abstract stats tangible.
Slide Insights: From Metrics to Milestones
Slide 1`s progress wheel kicks off with goal attainment visuals. Slide 9`s waterfall chart dissects revenue streams, isolating contributions. Reach Slide 17 for a heatmap of performance zones, color-coding hot spots.
Slides 23-27 feature comparative radars for year-over-year growth, with spokes for key indicators. End on Slide 28`s trophy infographic, summarizing ROI highlights. All slides include tooltips for deeper dives during live sessions.
Use Cases in Action: Wins Across Industries
Sales teams use the funnel analyzer (Slide 5) to pinpoint conversion leaks, boosting close rates by 15% in one agency`s trial. Educators in business schools pair growth curves (Slide 12) with case studies, engaging MBAs in real analytics. Non-profits leverage impact dashboards (Slide 26) for donor pitches, securing funding through vivid proof.
For startups, it`s a pitch deck enhancer, visually proving traction to investors. Tailor it today and let your results shine brighter.
Edge Over Standard Tools: Results Redefined
PowerPoint defaults lack narrative flair; this template weaves data into stories with contextual icons and phased reveals, enhancing trustworthiness via cited design principles. It`s the professional upgrade for outcome-focused communicators.
Conclusion: Spotlight Your Success
Elevate every report - download the Good Results PowerPoint Template for $22 and make your achievements unforgettable.
Frequently Asked Questions
Supports advanced charting?
Yes, from sparklines to Sankey flows for nuanced data.
Works on Mac?
Perfectly, with full PowerPoint for Mac compatibility.
Integrate live data?
Absolutely, via OLE links to spreadsheets.
Color scheme count?
Seven, optimized for accessibility and impact.
Team licensing?
Lifetime access for your entire organization.