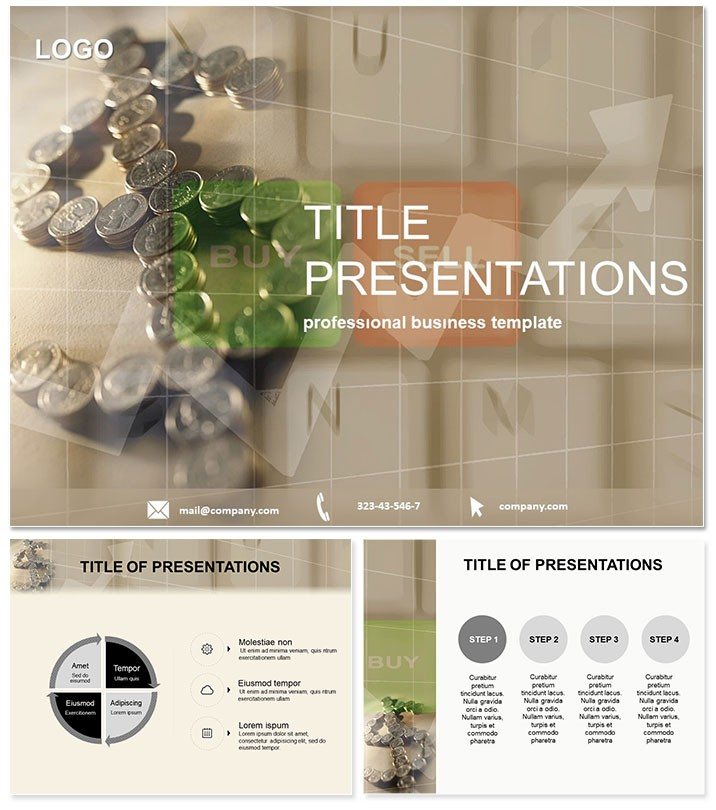
Navigating the volatile world of foreign exchange can be daunting, but our Course: Buy and Sell PowerPoint Template makes it straightforward and compelling. Geared toward financial advisors, bankers, and traders, it spotlights exchange rates across cities and countries with intuitive buy/sell indicators and dollar-centric visuals. Transform dry data into digestible stories that resonate with clients or colleagues.
Why invest in this? Accurate, visually appealing info builds credibility in high-stakes finance. At a one-time $22 with lifetime access, it`s compatible across PowerPoint 2016+ devices. Elevate your reports from routine to remarkable. Get started today and exchange ideas effortlessly.
Financial Flow: Essential Features
This PowerPoint chart template excels with three versatile masters, three clean backgrounds, and 28 data-rich diagrams. Seven color schemes - from greens for gains to reds for risks - adapt to your firm`s palette.
- Dynamic Icons: Dollar signs and arrow flows for instant buy/sell comprehension.
- Data Integration: Pre-formatted tables for real-time rate imports.
- Responsive Design: Scales for boardrooms or mobile reviews.
- Export Options: Seamless to PDF or images for reports.
Perfect for blending numbers with narrative in any financial context.
Mapping the Slides: From Rates to Insights
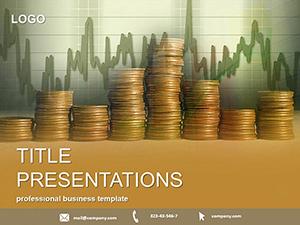
Slide 1 sets the stage with a global overview map, color-coded by region. By slide 7, drill into urban vs. rural bank rates with bar comparisons. Central slides 14-20 feature line graphs tracking fluctuations, annotated with key events like policy shifts.
Wrapping up, slides 24-28 simulate scenarios: What-if analyses for hedging strategies, complete with pivot tables. Each diagram supports seven schemes, ensuring accessibility in low-light settings.
Finance pros praise its ability to forecast discussions, turning slides into conversation starters.
In Action: Finance and Beyond
A currency trader preps for a client meet: This template visualizes EUR/USD trends, clarifying buy opportunities amid volatility. In academic econ classes, professors use it to teach exchange mechanics, with students recreating slides for exams.
For international businesses, it`s invaluable in quarterly reviews, comparing supplier costs across borders. Outshines default charts by embedding contextual tooltips, reducing explanation time by half.
Superior to Standard Tools
PowerPoint defaults lack finance-specific flair; this template`s layered animations reveal trends progressively, enhancing retention. Expert-vetted for accuracy, it`s a trustworthy ally in compliance-heavy fields.
Lifetime license scales with your career.
Secure your edge in exchanges. Customize now for currency command.
Frequently Asked Questions
What data formats does it support?
Excel imports, CSV, and manual entry for rates.
Mac compatible?
Yes, PowerPoint 2016+ on macOS.
Number of color schemes?
Seven, optimized for professional palettes.
Editable graphs?
Fully, with formula preservation.
For beginners?
Yes, guided layouts ease entry.
Guarantee?
30-day full refund.