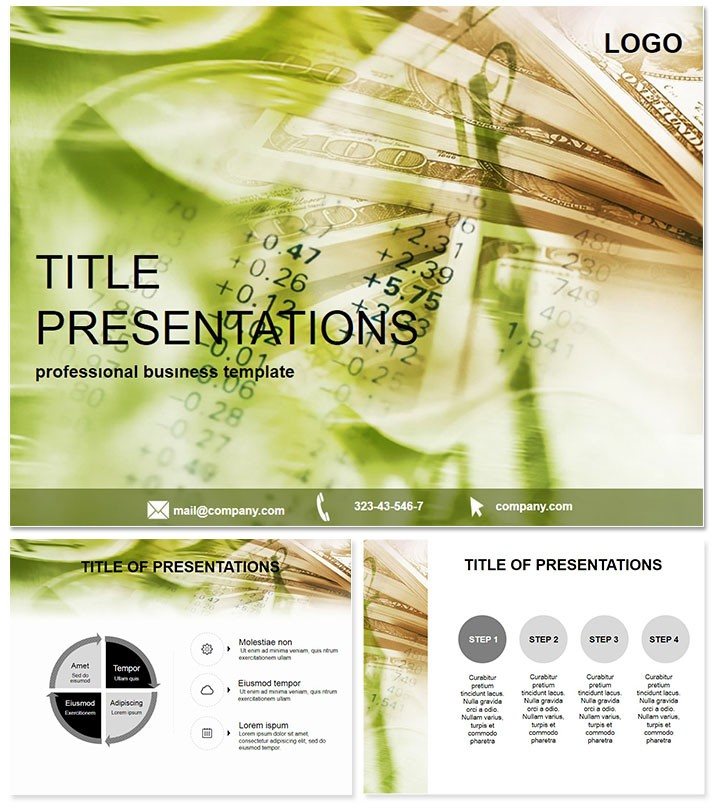
In the volatile dance of stocks and currencies, presentations that cut through noise to reveal opportunities are gold. The Stock Market PowerPoint Template equips investors, analysts, and finance teams with 28 precision diagrams across seven color schemes, visualizing everything from volatility curves to portfolio balances. Tailored for PowerPoint 2016+, it offers lifetime utility through a straightforward one-time fee, empowering data-driven decisions with style.
Track bull runs via line graphs or dissect forex fluctuations with candlesticks - these slides make numbers narrate, turning reports into roadmaps for wealth growth.
Premier Features for Finance Mastery
Forged by Wall Street presentation gurus, it boasts three masters and sleek backgrounds. Essentials:
- 28 Finance-Centric Diagrams: Candlestick patterns for trading signals, bubble charts for risk-return profiles, and waterfall models for P&L breakdowns.
- Seven Market-Inspired Colors: Greens for gains, reds for alerts, with gradients for trend shading.
- Advanced Customization: Formula-linked cells for real-time calcs, plus ticker-style animations.
- Secure Exports: Password-protected PDFs for confidential client shares.
Conditional formatting auto-highlights anomalies, like spiking volumes.
Strategic Deployments in Investment Arenas
Excel in boardrooms or webinars alike. A hedge fund`s quarterly uses the matrix diagram to quadrant assets by performance, guiding reallocations with evidence.
Bankers pitch currency hedges via the forex line slide, overlaying economic indicators for contextual depth. Startup CFOs employ the growth projection funnel to forecast funding rounds, impressing VCs.
Case in Point: Navigating a Portfolio Pivot
An advisory firm illustrated sector shifts with the pie evolution animation, morphing allocations over quarters. Clients approved the strategy, yielding 18% returns in the following year.
Trumping Typical PowerPoint Finance Tools
Default tables overwhelm with raw data; this template distills via interactive slicers and scenario sliders, simulating what-ifs live. Vector charts scale without blur, and macro-free design ensures compliance.
Analysts cut prep by 65%, with audit-trail notes embedded for transparency. It`s finance fortified for the future.
Invest in your presentations` potential. Claim the Stock Market PowerPoint Template and trade up your impact.
Frequently Asked Questions
Supports Excel data imports?
Seamlessly - paste-linked tables update diagrams automatically on refresh.
Best for crypto visuals too?
Yes, adaptable candlesticks and volume bars suit blockchain trends.
Color schemes for dark mode?
Included - reversible palettes prevent eye strain in low-light reviews.
Commercial rights extent?
Full spectrum: advisory, trading floors, or educational finance courses.
Animations for trend reveals?
Progressive builds chart rises/falls, mirroring market momentum.