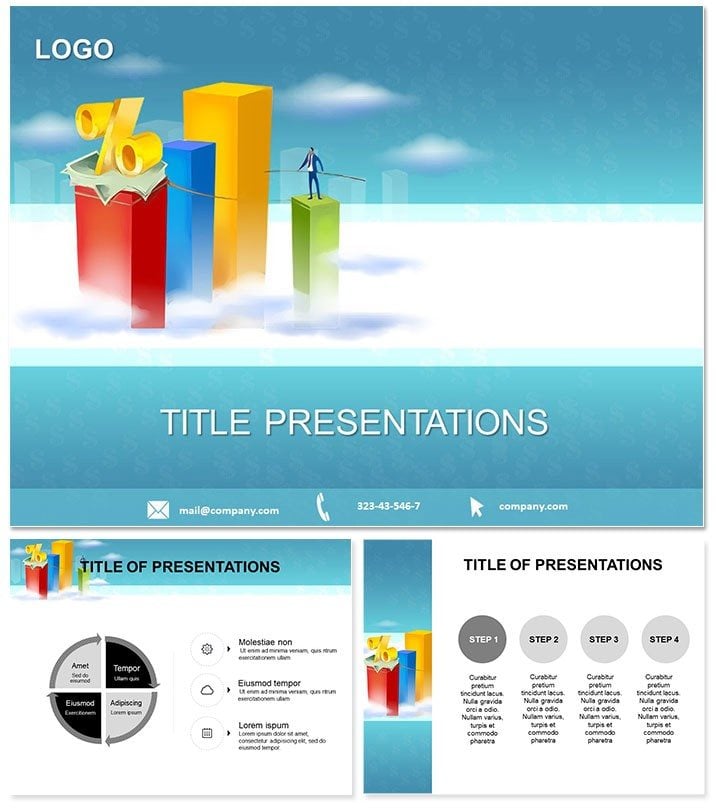
Unlock the hidden bottlenecks in your operations and propel your business forward - our Activity Analysis PowerPoint Template is the diagnostic powerhouse that reveals inefficiencies and charts paths to peak productivity. Crafted for managers, consultants, and process optimizers, it demystifies workflows, turning dense audits into digestible, action-oriented stories that drive real change.
Rooted in lean principles yet flexible for any sector, this template visualizes the pulse of your activities - from daily tasks to enterprise-scale overhauls. It`s your ally in boardroom battles or team huddles, compatible with PowerPoint 2016+, ensuring hassle-free adoption. Invest once at $22 for lifetime rights, and watch savings compound as you refine and repeat.
Diagnose and Dominate Your Workflows
Businesses bleed resources on unseen drags; this template spotlights them with surgical precision. Swap out vague reports for crystal-clear visuals that pinpoint waste, celebrate wins, and forecast gains. Its clean, corporate aesthetic - think flowchart rivers and metric mountains - keeps focus sharp, avoiding the clutter that plagues homemade slides.
Effortless evolution: Tweak via drag-and-drop, layer in KPIs from spreadsheets, or theme to your org`s palette across seven schemes. Three masters anchor consistency, while backgrounds evoke progress without distraction. The outcome? Presentations that not only inform but inspire immediate implementation.
Core Capabilities for Process Pros
- 28 Analytical Diagrams: Swimlane maps for cross-dept flows and bottleneck radars for quick scans.
- 7 Neutral Color Sets: Subtle gradients for professional poise in any lighting.
- 3 Masters and Backgrounds: Tailored for audits, trainings, or executive summaries.
- Data-Linked Elements: Sync with Excel for live refreshes during reviews.
- PowerPoint-Ready Assets: .potx files for native editing, .jpg previews included.
Unpacking the Process Toolkit
Begin at Slide 1 with a holistic value stream map, outlining end-to-end activities for baseline assessments. Slides 2-5 dissect task hierarchies, stacking subprocesses to expose redundancies in procurement chains.
Advance to Slides 6-10: Pareto charts prioritizing defects, with bars scaling to impact levels for targeted fixes. For deeper dives, Slides 11-15 offer cycle time funnels, narrowing from initiation to completion to flag delays.
Optimization peaks in Slides 16-20, featuring before-after matrices contrasting old vs. new protocols, quantifying ROI uplifts. Close with Slides 21-25`s dashboard aggregates and 26-28`s predictive trees modeling future states post-improvements.
Transformative Use Cases Across Industries
A manufacturing lead deploys swimlanes to revamp assembly lines, slashing cycle times by 30% and earning C-suite kudos. Consultants craft client deliverables with metric dashboards, accelerating project wins and billables.
In services, HR pros map onboarding flows, streamlining hires and boosting retention. Retail analysts use Pareto visuals for inventory audits, minimizing stockouts and maximizing margins - real efficiencies that resonate.
Surpassing Standard PowerPoint Analytics
Built-in PowerPoint charts? Solid starters, but flat. This template turbocharges them with pre-validated layouts and automation hooks, halving analysis-to-slide time. Engage more, iterate faster, achieve more.
Spot your next breakthrough? Download today and analyze with authority.
Frequently Asked Questions
Supports which PowerPoint versions?
From 2016 onward, fully across platforms.
Integrates with other tools?
Yes, Excel links and Visio imports for enriched data.
Customization level?
Comprehensive - edit every node, color, and label.
Purchase perks?
$22 lifetime, unlimited commercial applications.
For small teams too?
Perfectly scaled, from solos to enterprises.
Animation options?
Built-in sequences reveal steps progressively.
Refine relentlessly - customize your efficiency edge without delay.