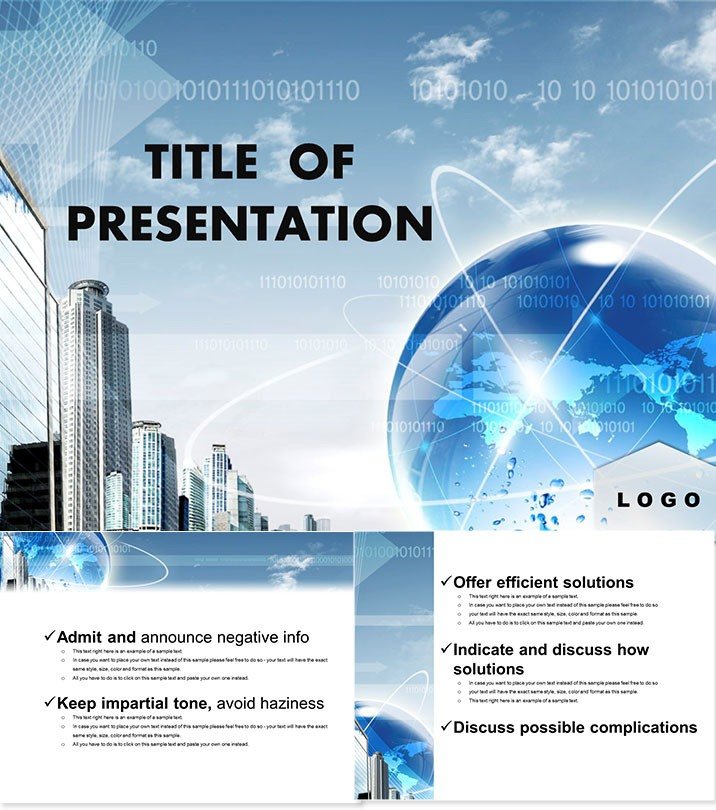
Step into the heartbeat of global metropolises with the World Cities PowerPoint template, where skyscrapers of data rise into engaging stories. This professional-grade set is your gateway to presenting cityscapes, demographics, and urban trends without the clutter of ordinary slides. Tailored for those navigating the complexities of modern urban planning, it turns raw statistics into vivid narratives that inform and excite. From bustling streets to sustainable skylines, every slide pulses with relevance, helping you connect with audiences who crave clarity in a crowded world.
Designed with the modern presenter in mind, this template integrates effortlessly into your toolkit. Its infographic-rich layout supports quick edits, ensuring your unique voice shines through. Compatible across PowerPoint 2016+ and Google Slides, it fosters real-time collaboration for teams worldwide. For just $22 one-time, unlock lifetime use - a smart investment in presentations that stand out.
Essential Features Driving Urban Presentation Success
What sets this template apart is its blend of aesthetics and functionality, crafted to handle dense urban data with grace. Boasting 28 diagram slides in seven color palettes, it offers versatility for any city`s vibe - from cool blues for coastal hubs to warm tones for desert dynamos.
- Three Versatile Masters: Framework your deck with layouts that scale from overviews to deep dives.
- Three Thematic Backgrounds: Subtle city silhouettes or abstract grids to set the urban tone.
- Infographic Powerhouse: Charts, maps, and timelines ready for your metrics on population growth or infrastructure.
- Seamless Customization: Adjust fonts, icons, and layouts intuitively, with vector precision.
- Collaboration-Ready: Cloud-friendly for shared editing sessions.
These elements combine to create decks that not only inform but also immerse, elevating your delivery.
Exploring the 28 Diagram Slides in Depth
The slides form a logical journey through urban themes. Kick off with Slide 1`s panoramic city map, pinpointing key districts for introductory overviews. By Slide 7, demographic bar graphs animate to reveal migration patterns, making stats pop.
Central slides like 14-18 tackle sustainability: donut charts for green space allocation, flowing into radial diagrams for transport efficiency. Wrap with Slide 26`s comparative table, pitting cities head-to-head on livability indices. Each slide builds on the last, crafting a cohesive urban tale.
Practical Use Cases for City-Focused Presenters
Urban planners swear by this template for council meetings, where layered maps illustrate zoning proposals, sparking informed debates. Educators use it in geography classes to dissect megacity challenges, pairing visuals with student polls for interactive lessons.
Business analysts in real estate leverage Slides 10-15 for market forecasts, visualizing ROI with animated growth curves - far superior to PowerPoint`s static defaults, which lack the thematic punch. A marketing director noted, "It helped us win the city contract by making our bid visually irresistible." Tailor it today and transform your pitch.
Superiority to Basic PowerPoint: A Quick Comparison
While vanilla PowerPoint offers basics, this template adds urban flair with pre-built infographics that save hours. Its color schemes ensure accessibility, and animations guide focus - boosting retention rates. Lifetime access means it`s future-proof, unlike one-off designs.
FAQ
Is this template Google Slides compatible?
Yes, it works flawlessly with Google Slides for easy online collaboration.
How do I add my own city data?
Simply replace placeholders in charts via the data editor - takes seconds.
Are the diagrams resizable?
All vectors, so they scale perfectly without pixelation.
What`s included in the purchase?
28 slides, masters, backgrounds, and icon packs for full customization.
Can I use it for commercial projects?
Definitely - lifetime commercial license included.
Does it support dark mode?
Yes, adaptable themes for any presentation style.