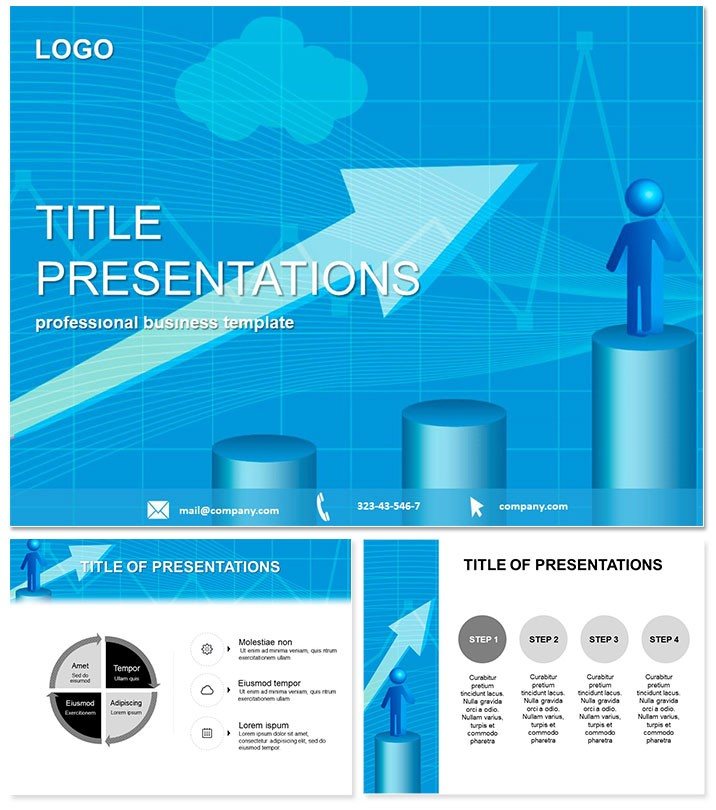
Unlock the power of persuasive financial storytelling with a template that turns numbers into narratives. The Finance Sequence Growth PowerPoint Template is your ally in crafting decks that not only inform but inspire action, whether you`re forecasting revenues or analyzing market trends.
Crafted for finance pros who demand clarity amid complexity, this template uses sleek growth motifs - like ascending arrows and blooming graphs - to visualize progress. With 28 diagram slides at your disposal, you can dissect quarterly results or pitch investment opportunities with confidence. It`s optimized for PowerPoint 2016 and beyond, ensuring smooth performance across devices.
In an era where data overload is real, this tool cuts through the noise, helping you focus on insights that drive decisions. A one-time $22 investment unlocks lifetime edits, making it a staple for ongoing boardroom battles or client consultations.
Essential Features for Financial Pros
- Three Master Layouts: Maintain brand consistency with minimal effort.
- Three Thematic Backgrounds: Subtle finance-inspired patterns that enhance without distracting.
- 28 Dynamic Diagrams: From line graphs to funnel charts, all finance-focused.
- Seven Palette Options: Match corporate greens or bold reds for impact.
- Seamless Editability: Drag-and-drop data integration for real-time updates.
These features aren`t bells and whistles; they`re the backbone of efficient presentation building, saving you from tedious recreations.
Diving into the Diagram Slides
Start strong with slide 1`s revenue growth bar chart, where bars rise like market indices against a minimalist backdrop. By slide 4, encounter a sequence flowchart perfect for detailing investment pipelines, with nodes that expand on hover for deeper dives.
Midway, slides 12-18 shine with comparative pie charts and stacked area plots, ideal for breaking down asset allocations or expense breakdowns. The growth theme peaks in slides 22-28, featuring exponential curve diagrams that project future scenarios, complete with confidence intervals for that extra layer of credibility.
Each slide supports animations that reveal data progressively, building suspense and comprehension in tandem.
Practical Use Cases in Finance
Envision a CFO presenting Q4 earnings: Leverage the line graphs to trace revenue trajectories, highlighting peaks that align with strategic wins. Venture capitalists might use the funnel slides to map deal progression, from lead gen to close, impressing stakeholders with visual precision.
In consulting, adapt the pyramid charts for risk assessments, layering probabilities like financial strata. Users often note how these visuals boost persuasion, turning dry stats into compelling stories that secure buy-in.
Superior to Standard PowerPoint Tools
Default templates lack the nuance for finance - clunky charts that scream amateur. This one delivers pro-level polish, with pre-formatted axes and legends that adapt to your inputs. It`s faster, sharper, and infinitely more engaging, elevating your expertise on screen.
Elevate your fiscal forecasts today - grab the Finance Sequence Growth Template and watch your presentations scale new heights.
Frequently Asked Questions
Which PowerPoint versions work with this?
Supports 2016 through Microsoft 365, on Windows and Mac alike.
Can I import my Excel data directly?
Yes, charts link effortlessly to spreadsheets for live updates.
What`s the refund policy?
30-day money-back if it doesn`t meet your needs.
Are there mobile editing options?
Edit on PowerPoint mobile apps, though desktop yields best results.
How customizable are the colors?
Fully - seven schemes or create your own via theme editor.
Does it include icon libraries?
Vector icons for finance symbols are embedded for quick use.