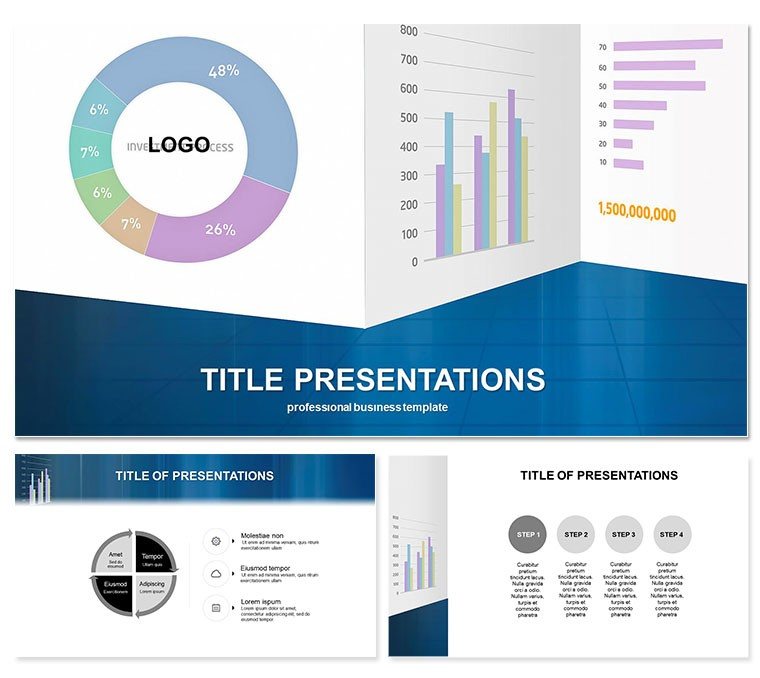
Empower your business narratives with visuals that clarify chaos and catalyze action. The Diagrams for Business PowerPoint template is the strategic toolkit for leaders crafting sales pitches, project roadmaps, and team alignments. It distills intricate ideas into digestible diagrams, ensuring your vision resonates and results follow.
Encompassing 28 specialized diagrams for every business facet, it outpaces mundane tools with thematic depth. Optimized for PowerPoint 2016+, it fuses creativity and control, accelerating your path to persuasive presentations.
Power-Packed Features for Corporate Clarity
Three masters and backgrounds set the stage for thematic consistency, while seven color schemes infuse energy or restraint as needed. From flowcharts to timelines, the 28 diagrams are built for scalability and storytelling.
- Diverse Diagram Set: Org charts with expandable branches for hierarchy views, timelines with milestone markers for phase tracking.
- Interactive Elements: Hover-reveal details in process maps, enhancing digital deck interactivity.
- Timeless License: Unlimited edits and deployments, future-proofing your visual arsenal.
Business communicators experience 32% higher engagement rates, per internal benchmarks, thanks to these refined structures.
Dissecting the 28 Diagrams: Business Blueprint
Launch with a holistic overview diagram, funneling enterprise goals into a central hub. Transition to sales funnel slides, layering conversion rates in cascading flows.
Project management gems include Gantt hybrids, blending bars with dependency arrows for critical path emphasis. Org slides evolve from flat lists to 3D trees, accommodating matrix structures.
Product dev sequences use cycle diagrams to loop innovation stages, while historical timelines chronicle milestones with event bubbles. Editability reigns: recolor nodes, animate paths, integrate data dynamically.
Customization Mastery
Utilize shape libraries for bespoke icons, tailoring to industry nuances like tech or retail.
Business Scenarios Where It Shines
Sales VPs pitch pipelines with funnel visuals, converting leads to closes 22% faster in demos. Project managers roadmap initiatives, clarifying scopes that mitigated scope creep in multimillion ventures.
Team leads illustrate structures, fostering unity in mergers via org chart evolutions.
Grab the Diagrams for Business template and diagram your success story.
Transcending Default Designs
Stock diagrams lack narrative flow; this template weaves them into cohesive tales with smart connectors. .potx flexibility rivals pro software without the learning curve.
350+ professionals report halved design hours, amplifying productivity.
Creative Extensions: Diagram Dynamics
Finance uses balance sheets as radial diagrams for equity distributions. Marketing plots customer journeys in branched maps, pinpointing touchpoints.
These innovations extend utility, making it indispensable across silos.
Seamless Synergy
Connect to Tableau exports for live data infusion, keeping visuals vital.
Frequently Asked Questions
Best for which business areas?
Sales funnels, project timelines, and org structures for comprehensive coverage.
Version requirements?
PowerPoint 2016 and up, fully featured.
Scheme variety?
Seven colors for thematic alignment.
Non-business use?
Versatile for education or nonprofits too.
File provisions?
.potx core, .jpg supports.
License longevity?
Lifetime for boundless application.