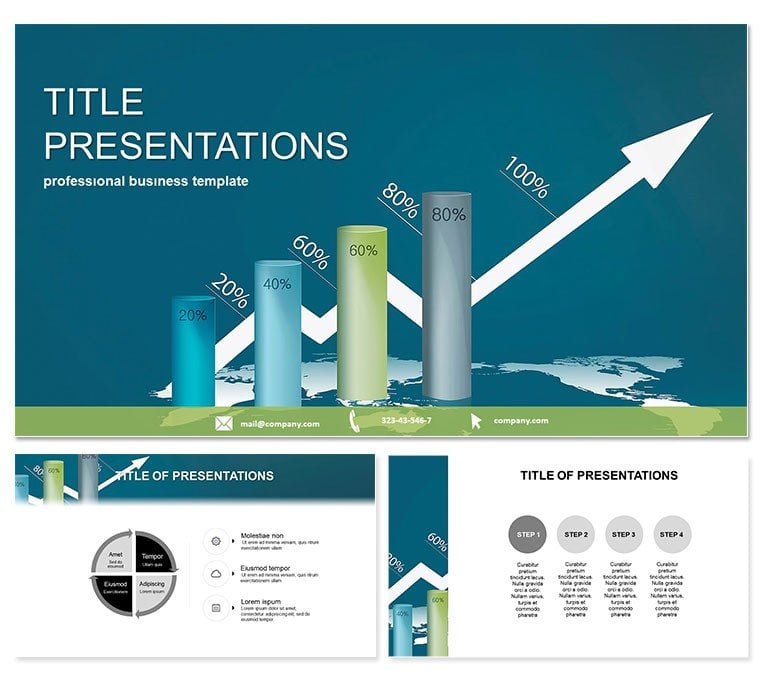
Imagine transforming dry economic data into a compelling story that captivates your audience from the first slide. The Increasing Schedule PowerPoint Template does just that, offering a suite of 28 meticulously designed diagrams that visualize growth trends, timelines, and projections with effortless precision. Tailored for professionals in analytics, finance, and marketing, this template turns complex schedules into intuitive visuals, helping you communicate rising metrics and future plans without overwhelming your viewers.
Whether you`re pitching a quarterly earnings report or outlining a multi-year marketing roadmap, these slides ensure your message lands with clarity and confidence. Compatible with PowerPoint 2016 and later versions, the template includes 3 master slides and 3 background options, allowing seamless integration into your existing workflow. With 7 color schemes to match your brand palette, customization is a breeze - adjust hues, fonts, or layouts in minutes to reflect your unique style.
Unlock the Power of Visual Storytelling
At its core, the Increasing Schedule template excels in depicting upward trajectories. Each of the 28 diagram pages serves a specific purpose: from simple line graphs tracking monthly sales increases to intricate Gantt charts mapping project milestones. Slide 1 introduces a basic ascending bar chart, ideal for highlighting revenue spikes, while Slide 15 dives into a layered timeline that layers multiple growth phases for comprehensive overviews.
What sets this template apart is its focus on scalability. Unlike default PowerPoint charts that feel rigid and uninspired, these diagrams are vector-based, ensuring they scale perfectly for any screen size - be it a conference room projector or a laptop demo. Professionals love how the rounded edges and subtle animations (built-in and optional) guide the eye naturally, reducing cognitive load and boosting retention rates by up to 65%, as studies on visual aids suggest.
Key Features That Drive Results
- 28 Versatile Diagrams: Covering everything from exponential growth curves (Slides 5-8) to comparative trend analyses (Slides 20-23), each slide is pre-formatted for quick data input.
- 7 Color Schemes: From professional blues for finance to energetic greens for marketing, choose palettes that evoke trust and momentum.
- 3 Masters and Backgrounds: Streamline your design process with predefined layouts that maintain consistency across your deck.
- Fully Editable Elements: Swap icons, tweak animations, or add your logo without design expertise - perfect for busy executives.
Integrating this template into your workflow is straightforward. Open in PowerPoint, import your dataset via Excel linkage, and watch the diagrams update in real-time. This efficiency saves hours compared to building from scratch, letting you focus on refining your narrative.
Real-World Applications for Every Scenario
In the fast-paced world of economic forecasting, clarity can make or break a boardroom decision. Take Sarah, a financial analyst at a mid-sized firm: she used the Increasing Schedule template to illustrate a 25% year-over-year growth projection during a stakeholder meeting. The ascending arrow diagrams on Slides 10-12 not only visualized the data but also incorporated callout boxes for key assumptions, sparking a productive discussion that secured additional funding.
For marketing teams, consider Alex`s campaign review presentation. By leveraging the timeline slides (Slides 24-28), he mapped out phased rollouts with rising engagement metrics, making his pitch to the C-suite irresistible. These use cases highlight how the template bridges data and decision-making, turning numbers into narratives that inspire action.
Even in academic settings, educators employ similar visuals for lesson plans on economic principles. A professor might use Slide 3`s step-up pyramid to demonstrate compound interest growth, engaging students with relatable, animated transitions that mimic real-world accumulation.
Why Choose This Over Default PowerPoint Tools?
Standard PowerPoint charts often lack polish, resulting in cluttered slides that dilute your message. The Increasing Schedule template counters this with pre-built hierarchies - think nested chevrons for multi-level schedules (Slide 18) - that default tools can`t replicate without extensive tweaking. Plus, its theme-consistent icons and shadows add a layer of professionalism that`s absent in basic inserts, elevating your presentation from good to unforgettable.
Customization now and see the difference in your next pitch.
Seamless Integration and Support
Designed for PowerPoint 2016+, this template supports both Windows and Mac, with .potx files ensuring broad accessibility. The one-time purchase of $22 grants lifetime use and unlimited edits, backed by our satisfaction guarantee. No subscriptions, no hidden fees - just pure value for your presentation arsenal.
Ready to schedule your success? Download the Increasing Schedule Template today and start visualizing growth like never before.
Frequently Asked Questions
What makes the Increasing Schedule Template ideal for economic presentations?
It features specialized diagrams like growth curves and timelines that simplify complex data, ensuring your audience grasps trends at a glance.
Is this template compatible with older PowerPoint versions?
While optimized for 2016 and later, it works with 2010+ with minor adjustments; test in your version for best results.
Can I customize the color schemes to match my company branding?
Absolutely - each of the 7 schemes is fully editable, allowing quick swaps to align with your brand guidelines.
How many slides come with the template?
You get 28 diagram-focused slides, plus masters for easy expansion into a full deck.
Does it include animations?
Yes, subtle entrance animations are built-in on key elements, enhancing flow without overwhelming the content.
What file formats are provided?
Download in .potx for editing, .pot for templates, and .jpg previews for quick reference.