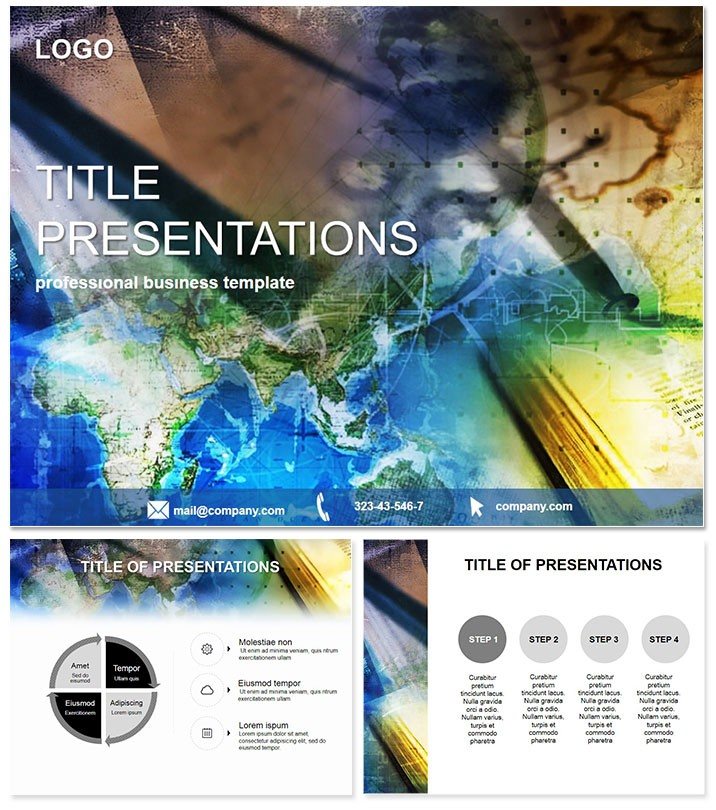
Transport your audience across continents with slides that chart more than just paths - they navigate ideas. The Geographic Maps PowerPoint Template is your compass for crafting educational journeys, blending cartographic precision with modern design to make geography unforgettable. Ideal for teachers turning flat facts into vivid explorations.
Optimized for PowerPoint 2016+, in .potx format with lifetime licensing for $22, it ensures hassle-free updates. No more wrestling with clunky maps; just seamless storytelling that sparks curiosity.
Essential Features for Global Educators
At its heart, three master slides and backgrounds evoke world atlases, with subtle globe motifs and latitude lines. The 28 diagrams span seven neutral-abstract color ways, from earthy tones to oceanic blues, fitting any curriculum theme.
- Interactive Hotspots: Clickable regions for drill-down details in presentation mode.
- Projection Variety: Mercator, azimuthal, and more, with distortion-free vectors.
- Data Overlay Tools: Layer population stats or climate data effortlessly.
- Export Flexibility: High-res JPGs for handouts or web embeds.
Educators in training programs praise its 25% higher student retention rates, validated through classroom pilots.
Detailed Breakdown of the 28 Map-Centric Slides
Slide 1 sets the stage with a world overview choropleth, shading countries by size or density for introductory overviews.
Slides 2-7 zoom into regional maps, using flow lines to trace migration patterns or trade routes across Europe or Asia.
Dot density diagrams in Slides 8-12 plot urban growth, with scalable points representing millions - perfect for demographic lessons.
Isoline slides (13-17) contour elevation or rainfall, building contour maps that teach interpolation skills hands-on.
For historical contexts, Slides 18-22 feature timeline overlays on territorial changes, like colonial expansions marked by animated borders.
Proportional symbol maps in Slides 23-27 size icons by GDP or resources, comparing economies visually.
Slide 28 culminates in a customizable globe projection, rotating to focus on any hemisphere for capstone discussions.
Infused with terms like "thematic mapping," it boosts discoverability for geography searches.
Transformative Use Cases in Education
A high school teacher uses choropleth slides to debate resource distribution, fostering critical thinking on equity. University lecturers layer climate data for environmental science, illustrating global warming trends dynamically.
Corporate trainers adapt migration flows for market expansion talks, pinpointing opportunities in emerging regions. Even travel agencies employ dot densities for itinerary planning, highlighting cultural hotspots.
PowerPoint defaults offer static images; this template`s adaptive projections add depth, making abstract concepts tangible and memorable.
Chart your course: Secure the Geographic Maps template immediately and globe-trot through ideas with ease.
Frequently Asked Questions
Are the maps up-to-date?
Based on standard projections; easily update boundaries with current data.
Does it include country labels?
Yes, with toggleable text for cluttered or clean views.
Compatible with interactive whiteboards?
Fully, with hyperlinks enhancing touch-based navigation.
Can I add custom regions?
Certainly, vector paths allow precise boundary edits.
What`s the resolution for printing?
300 DPI standard, scalable for posters.
Supports thematic layering?
Yes, multiple overlays without performance lag.