 Click to zoom
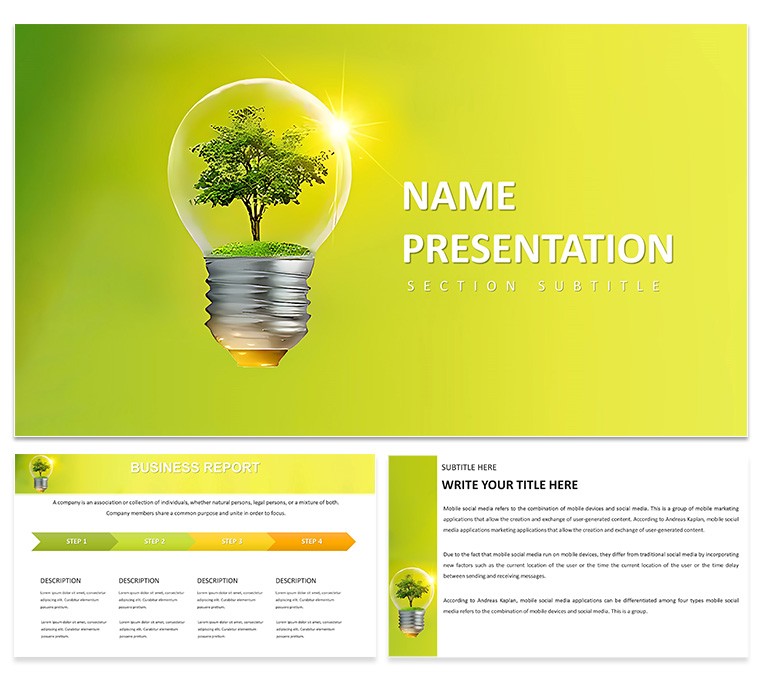
Plant Ecology Diagrams - Free Editable PPTX | ImagineLayout
| Format | .pptx |
| Slides | 3 unique layouts |
| Aspect ratio | 16:9 |
| Compatibility | PowerPoint |
| Animated | No |
| Language | English |
| License | Commercial |
| File size | — |
| Version | v1.0 |
| Last updated | April 2026 |
What's inside
Free base download - 3 masters and 3 backgrounds in .pptx and .potx - or $20 for the complete PowerPoint diagram template: 28 diagrams, 7 color schemes, all shapes and icon layers fully editable in PowerPoint 2016 and later. This is the only free-entry product among the four energy and innovation templates in this group.
The 28 diagrams cover process flows, idea matrices, and strategy roadmaps built around eco-energy and innovation themes. The icon set uses flat, filled shapes with consistent stroke geometry across all 28 slides - no mixed outline and filled styles within a single diagram, which keeps decks visually uniform when slides are reordered or combined from multiple files. The design emphasizes clean horizontal structure with balanced whitespace, a layout choice that keeps each slide readable at both the 13-inch laptop and wide-format projection sizes typical in consulting and IT strategy contexts.
Files ship as .pptx, .potx, and .jpg. PowerPoint 2016, 2019, 365, and the Mac PowerPoint version open all diagrams without conversion. Color scheme changes apply globally through the slide master: go to View → Slide Master, select the top master slide, open the Colors dropdown, and pick one of the seven built-in palettes - corporate blues, modern greens, and energetic oranges are among the included options. All 28 diagrams refresh simultaneously. Individual slide overrides work independently through Format → Shape Style without resetting the master.
The free tier supplies the 3-master and 3-background framework only - no diagram slides are included. The $20 paid version adds all 28 diagrams across all seven palettes with every element unlocked. Text placeholders update without ungrouping shapes; icon layers are replaceable without disturbing surrounding layout elements. These two behaviors - independent text editing and icon swapping - are the edits most commonly needed when reusing the same diagram structure across different client topics or quarterly cycles.
Consultants preparing strategy workshop decks, IT project managers building innovation roadmap presentations, and sustainability leads covering eco-energy themes across multiple departments are the users this template is structured for. The Renewable Energy Investment Diagrams PPTX covers capital-flow and ROI-specific structures for more finance-oriented energy presentations, and the full selection is available in the Consulting PowerPoint template category.
Download and start editing immediately
Specifications
FeatureDetailsDiagrams28 total - process flows, idea matrices, strategy roadmaps, eco-energy layoutsFile format.pptx, .potx, .jpgSoftware versionPowerPoint 2016, 2019, 365, MacColor schemes7 - apply to all 28 diagrams at once via View → Slide Master → ColorsEditable elementsText placeholders update without ungrouping; icon layers replace without layout disruptionAspect ratio16:9Free vs PaidFree: 3 masters + 3 backgrounds. Paid ($20): all 28 diagrams + 7 color schemes, no watermarksMasters / Backgrounds3 masters, 3 backgroundsFrequently Asked Questions
Which PowerPoint versions work with this template?PowerPoint 2016, 2019, 365, and the Mac version of PowerPoint open all 28 diagrams without file conversion. The slide master palette loads automatically so color changes apply uniformly. If using PowerPoint 2013 or earlier, some color scheme transitions may require manual adjustment, but all core shapes and text placeholders remain editable. The .potx file can also be set as a default theme for consistent use across future decks.
How do I switch color schemes across all 28 diagrams?Open View → Slide Master, select the top master slide, and click the Colors dropdown. Choose one of the seven built-in palettes - options span corporate blues, modern greens, and energetic oranges - or enter custom brand hex values to override any preset. All 28 diagrams update at once. Individual shape colors can still be overridden on any slide through Format → Shape Style; those local changes persist without affecting the master configuration.
Does the license allow use in paid client work?The license covers commercial use including paid consulting engagements, client-facing presentations, and internal company decks. Presentations assembled using this template can be delivered to external clients and used in billable service work. The template source files - .pptx and .potx - may not be resold as a standalone product or distributed independently of a finished presentation.
What does the free version include and what requires the $20 paid version?The free download contains 3 masters and 3 backgrounds in .pptx and .potx format. No diagram slides are included at the free tier. The $20 paid version adds all 28 fully editable diagrams across all seven color schemes with no watermarks. The process flows, idea matrices, and strategy roadmap slides are exclusively in the paid package - the free files provide the theme framework only.
Are the diagrams compatible with PowerPoint animation features?The diagrams are built with grouped objects and layers that support entrance, emphasis, and exit animations natively in PowerPoint. Individual elements such as arrows, icons, and text blocks can be animated to reveal content sequentially - useful for walking an audience through a multi-step process flow or staged roadmap without displaying all content at once. The clean whitespace layout ensures animations run smoothly without visual crowding.
Good for
- Project roadmaps and sprint plans
- Product launch timelines
- Quarterly or annual review decks
- Company history and milestone summaries
Licence
reviews
Pretty decent for a free template - the 3 masters and backgrounds are fine but you definitely need the paid version if you want actual diagrams and not just empty slides.
Used the process flows for an IT strategy workshop and the clean horizontal layout kept everyone focused, even the people who usually check their phones.
The icon set uses consistent stroke geometry which sounds nerdy but actually makes a huge difference when you're mixing slides from different presentations.
Changed all 28 colors at once through the slide master like the description said, took maybe two minutes - corporate blues looked way better than the default greens.
Good for consultants who need quick eco-energy visuals but don't want to spend forever tweaking individual icons.
FAQ
Will it work in Google Slides?
Are fonts embedded?
Can I use this for client work?
What's the refund policy?
Do you update the template after purchase?
Similar templates
See all PowerPoint Templates →


All 1 slides